

Real estate bubbles are a complex phenomenon. It is still up for debate whether a market is overvalued and swamped with speculative activity or is merely experiencing strong demand as it gains momentum and prices rise. let’s discuss global real estate bubble index and cities with real estate bubble.
Naturally, after a bubble pops, everything is clear to see.
When prices diverge from local wages and housing costs, this is a classic warning sign. A bubble may also be developing when there are imbalances in the actual economy, such as excessive lending and construction activity.
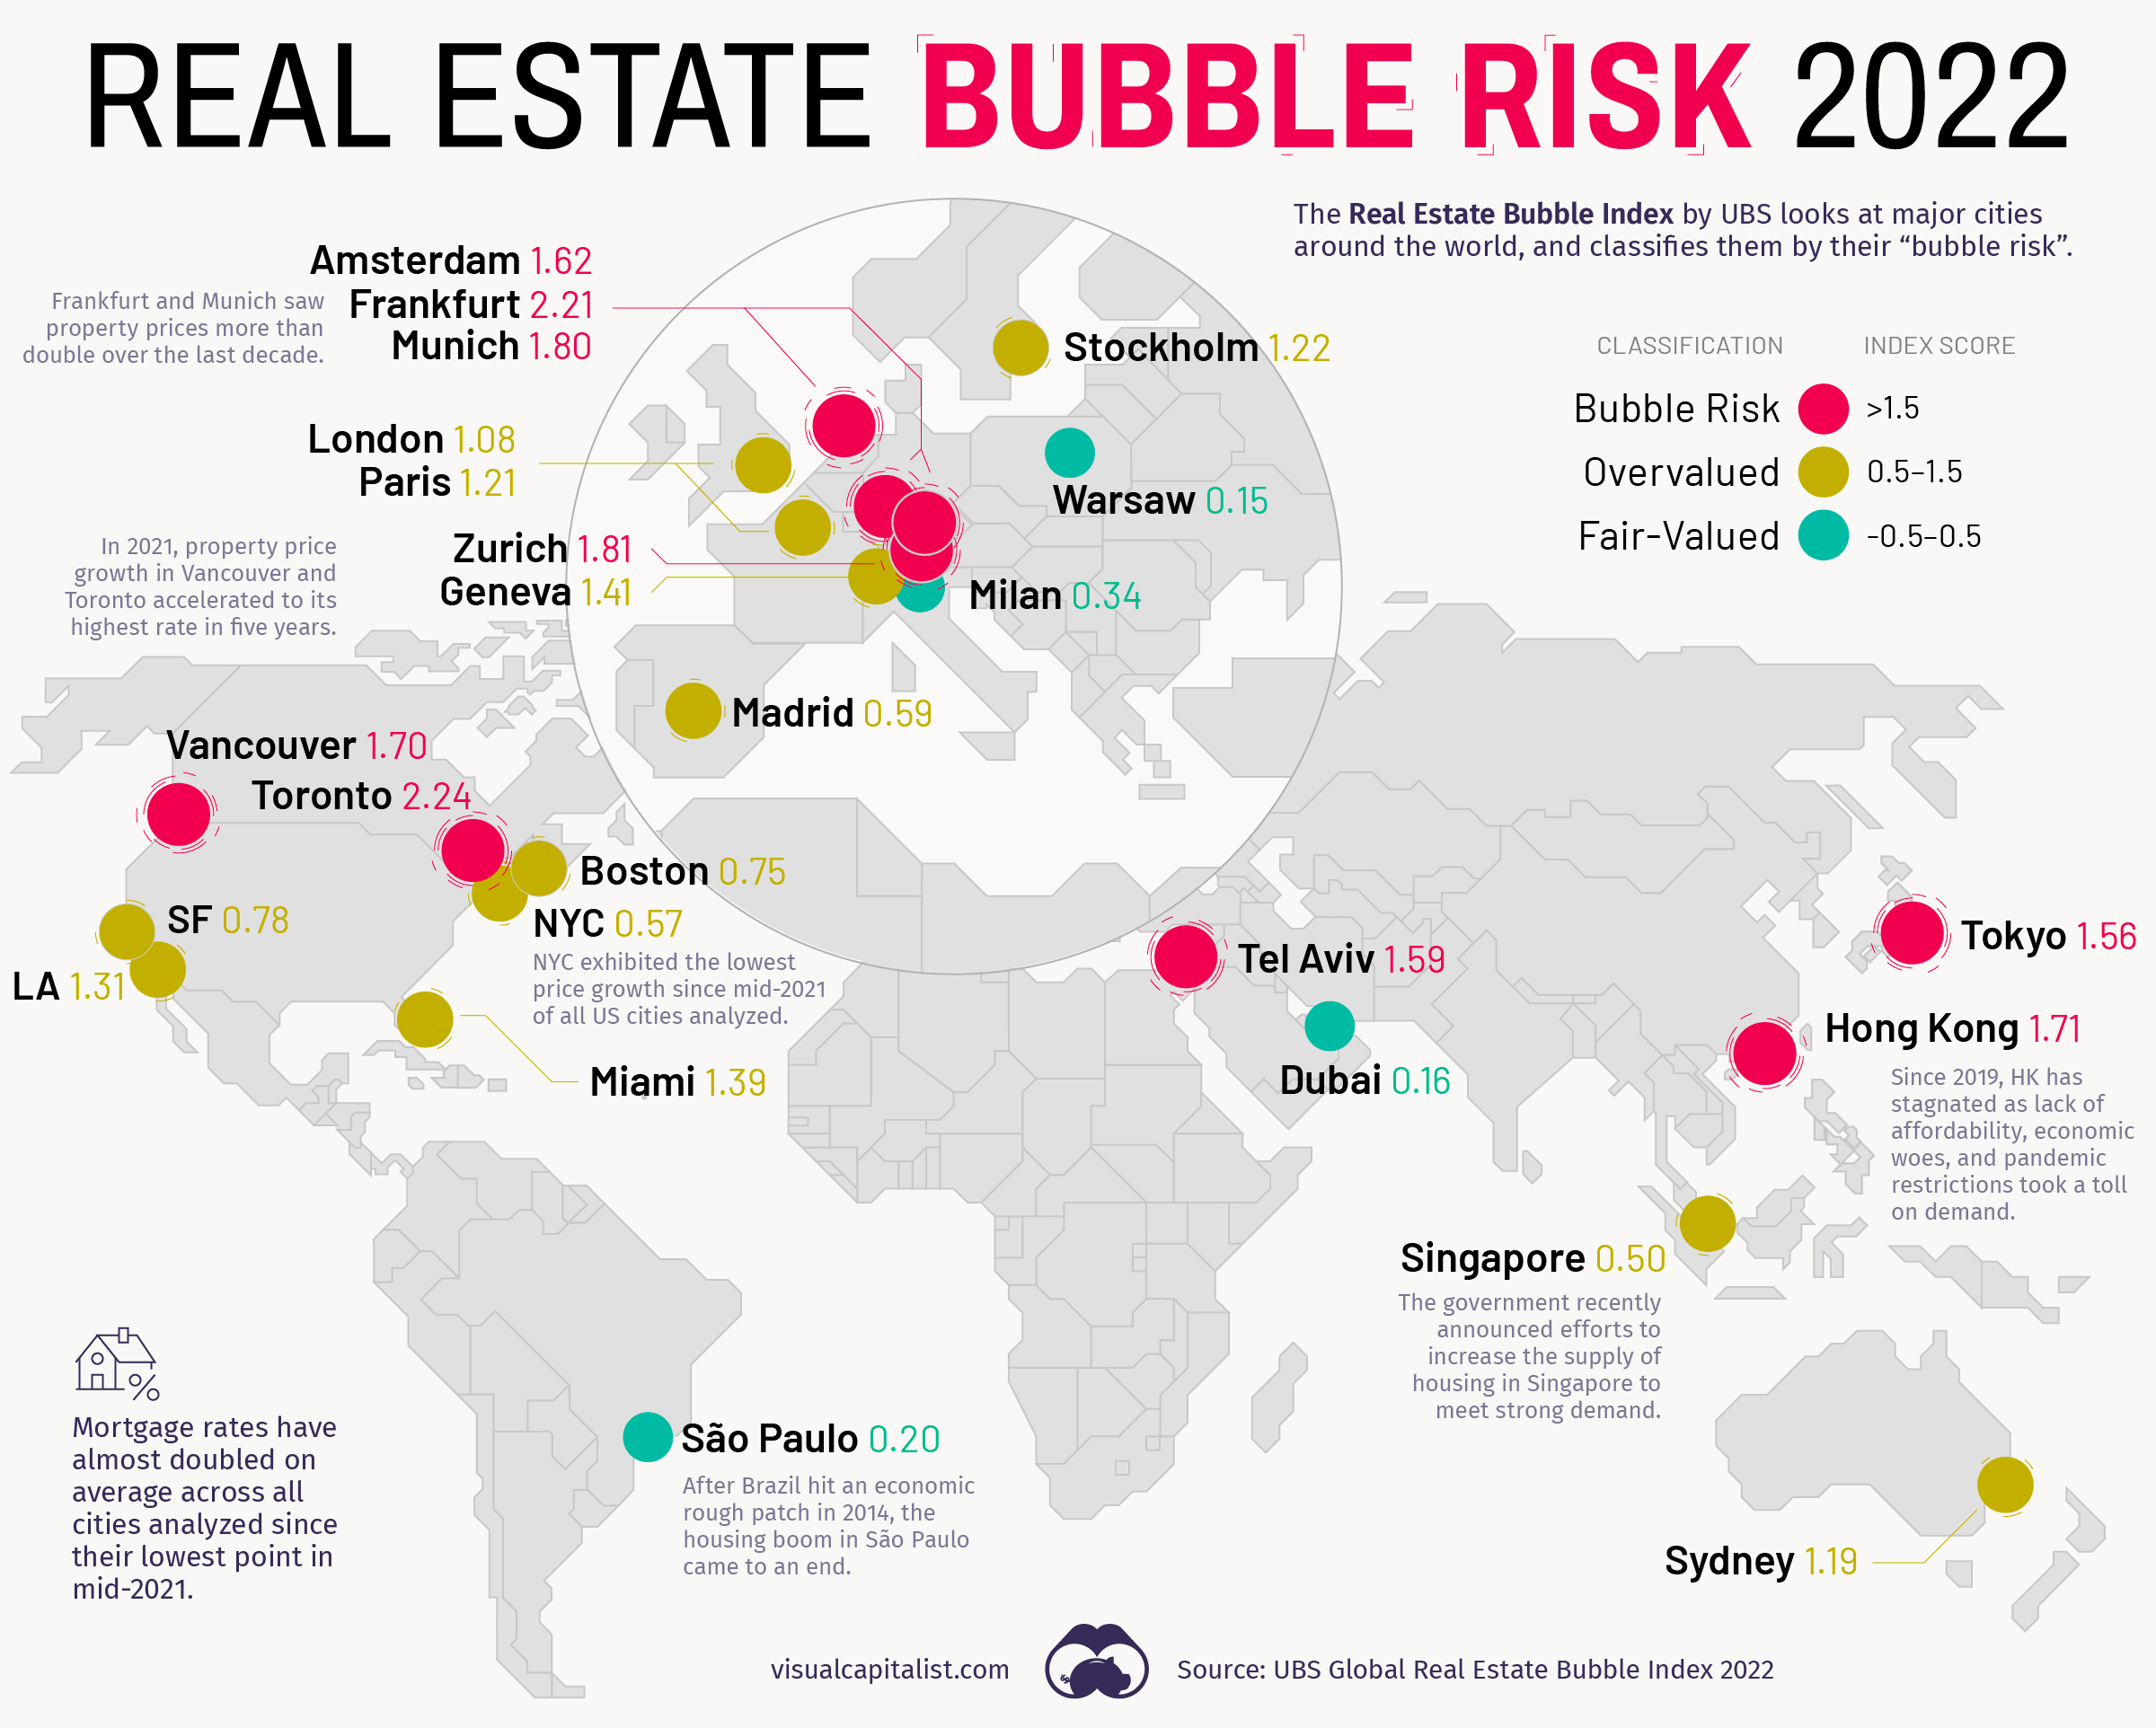
The map above evaluates 25 international locations and rates them according to their bubble risk using information from the Real Estate Bubble Index by UBS.
Global Real estate bubble index by cities
Nine of the cities evaluated in the Real Estate Bubble Index 2022 edition were categorized as having a very high bubble risk (1.5 or higher score).
| Rank | Risk Category | City | Bubble Index Score |
|---|---|---|---|
| #1 |  |  Toronto Toronto | 2.24 |
| #2 | |  Frankfurt Frankfurt | 2.21 |
| #3 | |  Zurich Zurich | 1.81 |
| #4 | | Munich | 1.80 |
| #5 | |  Hong Kong Hong Kong | 1.71 |
| #6 | | Vancouver | 1.70 |
| #7 | |  Amsterdam Amsterdam | 1.62 |
| #8 | |  Tel Aviv Tel Aviv | 1.59 |
| #9 | |  Tokyo Tokyo | 1.56 |
| #10 |  |  Miami Miami | 1.39 |
| #11 | | Los Angeles | 1.31 |
| #12 | |  Stockholm Stockholm | 1.22 |
| #13 | |  Paris Paris | 1.21 |
| #14 | |  Sydney Sydney | 1.19 |
| #15 | | Geneva | 1.14 |
| #16 | |  London London | 1.08 |
| #17 | | San Francisco | 0.78 |
| #18 | | Boston | 0.75 |
| #19 | |  Madrid Madrid | 0.59 |
| #20 | | New York | 0.57 |
| #21 | |  Singapore Singapore | 0.50 |
| #22 |  |  Milan Milan | 0.34 |
| #23 | |  Sao Paulo Sao Paulo | 0.20 |
| #24 | |  Dubai Dubai | 0.16 |
| #25 | |  Warsaw Warsaw | 0.15 |
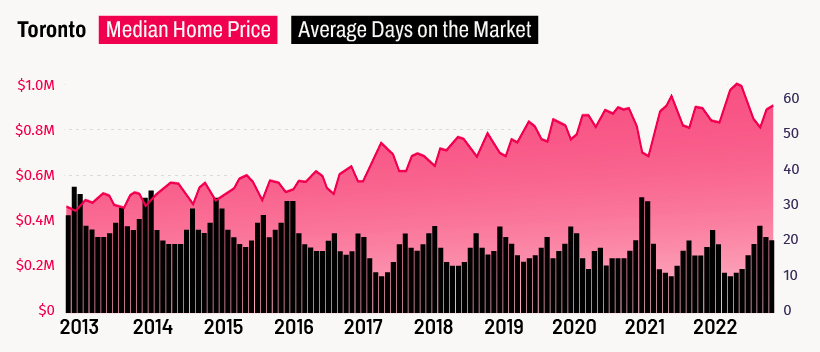
Canada , Toronto Real estate bubble
The largest city in Canada is at the top of a list that no city wants to be on. Since Toronto’s housing prices have been increasing regularly for years, many people, including UBS, think that the city has entered a bubble.
Vancouver is in a comparable circumstance. Both Canadian cities have booming IT industry and good standards of living.
Notably, none of the American cities under consideration fall within the category with the highest bubble risk. The closest-scoring U.S. city was Miami, which, with a score of 1.39, falls squarely in the overvalued range (0.5-1.5).
Looking at the Trends for Real Estate market :
Low borrowing rates have recently contributed to a wider disparity between housing values and salaries.
Prices have soared by an average of 60% in inflation-adjusted terms for cities in the bubble risk zone over the previous ten years, while rents and real wages have only increased by 12%. Furthermore, although COVID-19 temporarily reduced urban demand, rent increases in the cities under study were roughly comparable to those seen before to the pandemic.
Therefore, from a nominal price standpoint, all but three of the cities had positive price growth over the previous year:
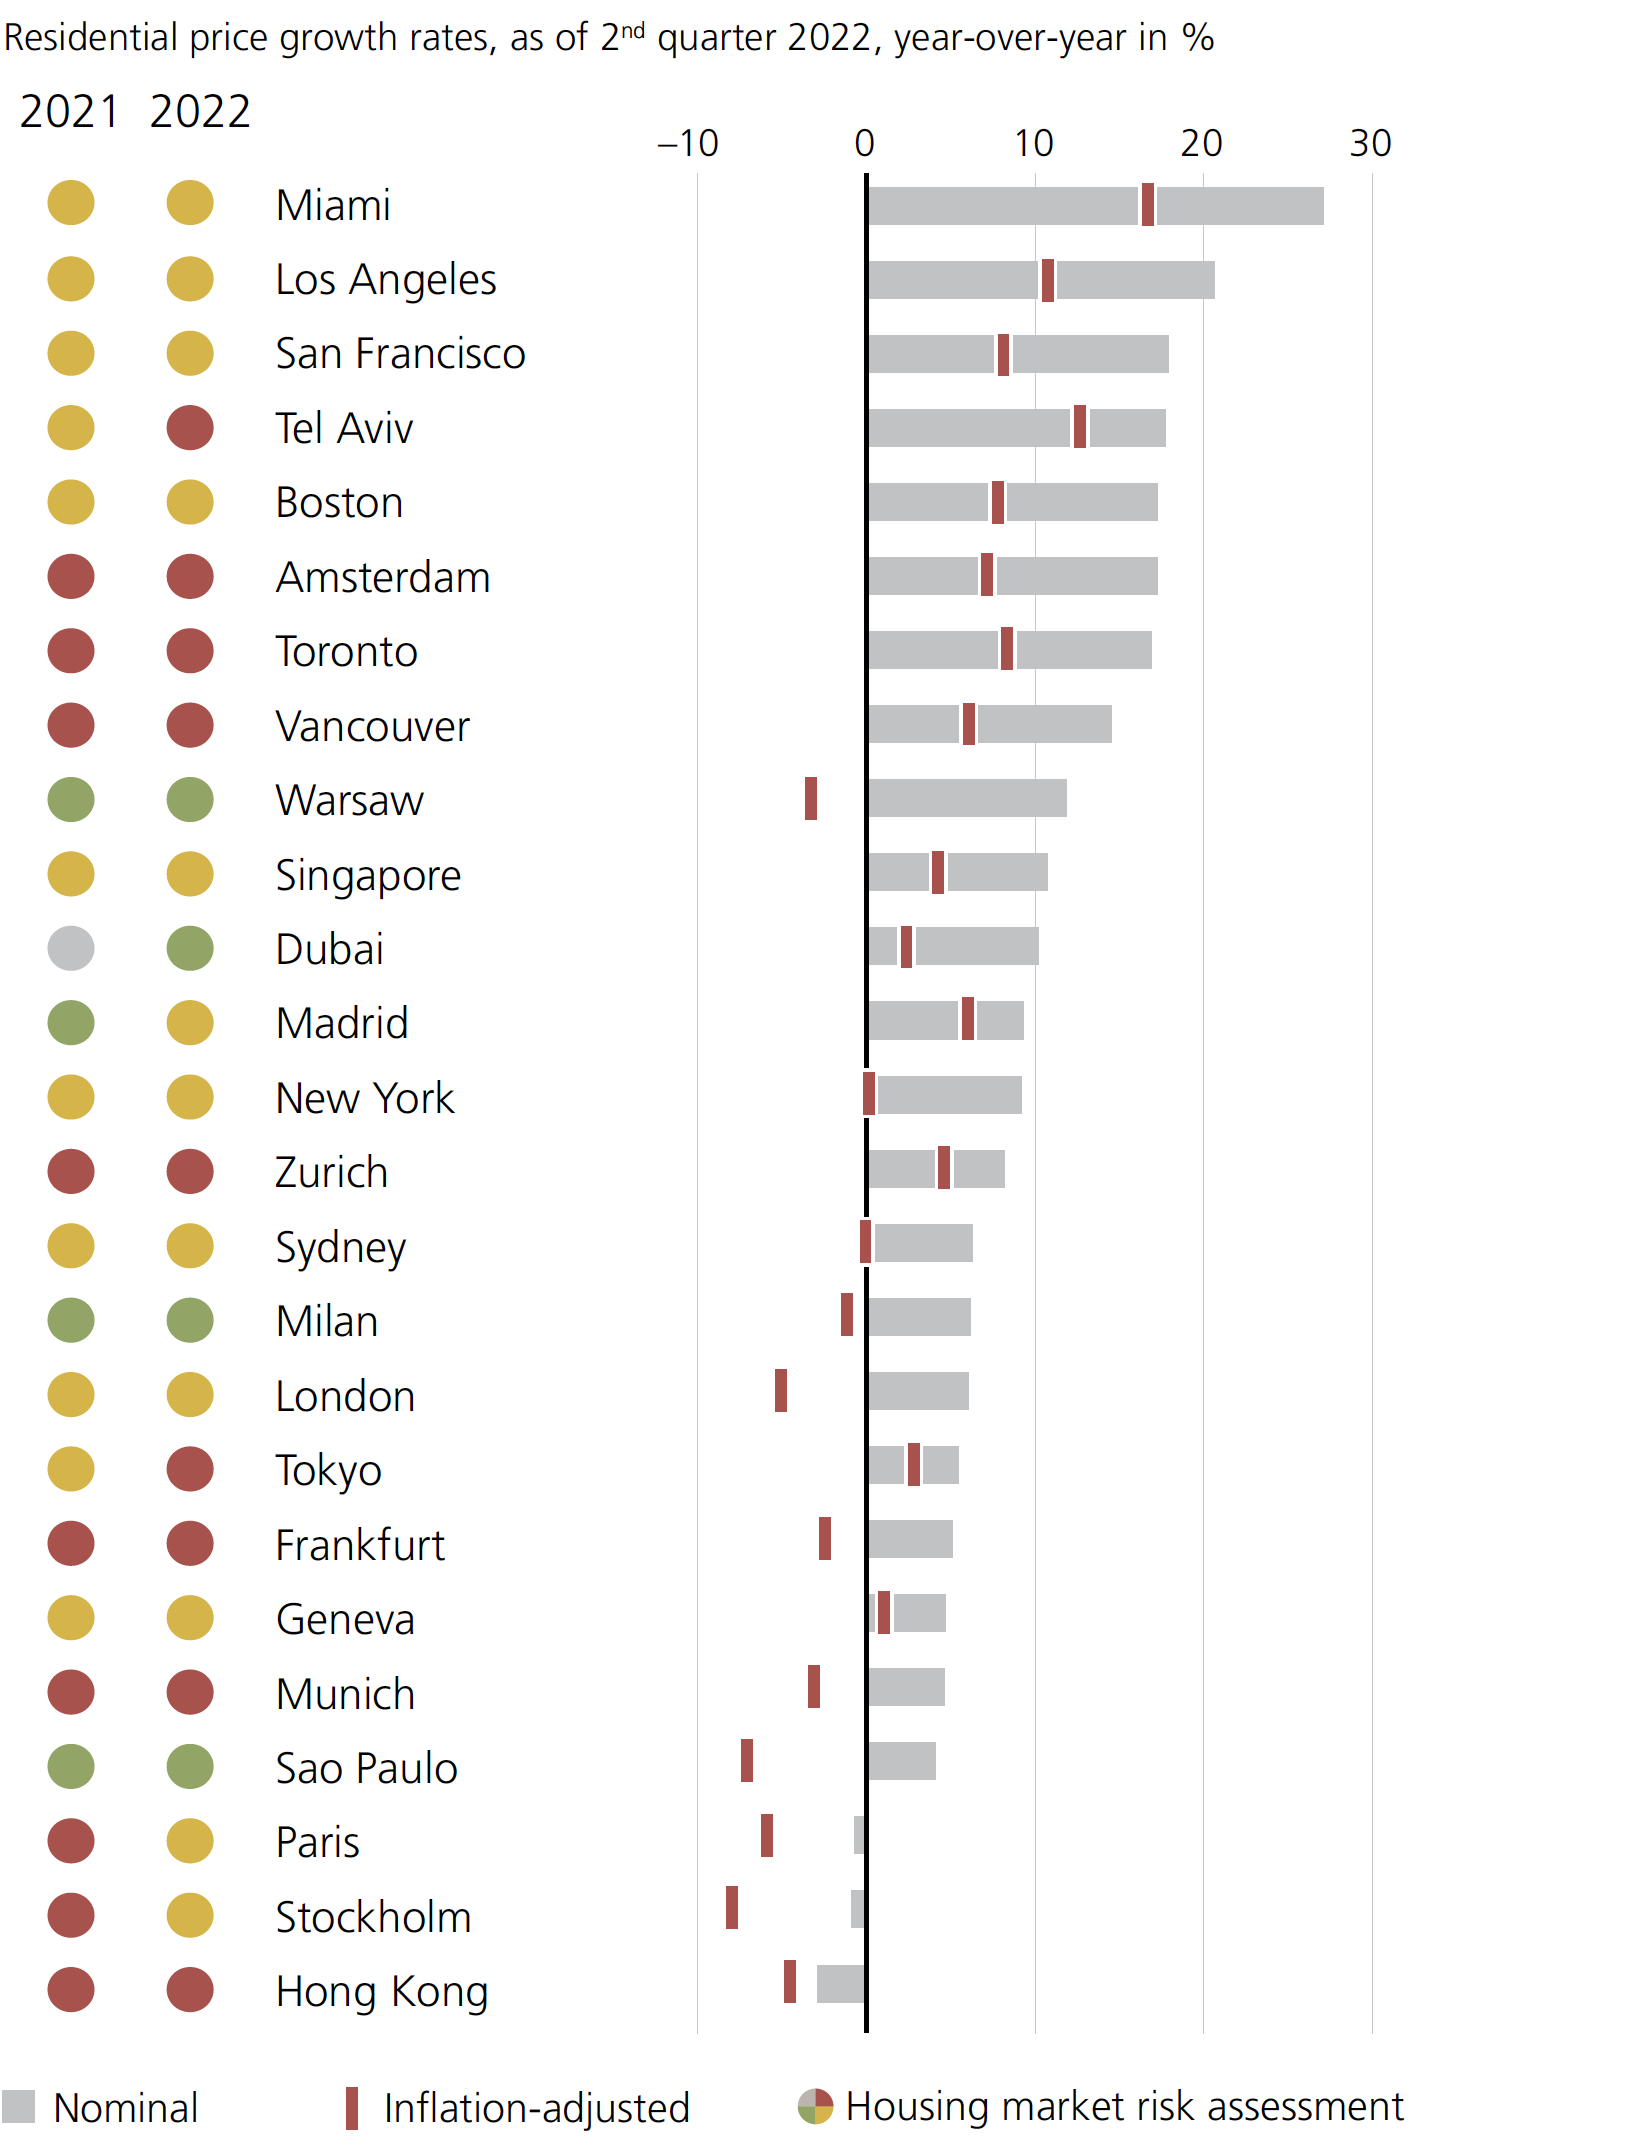
Real Estate bubble in US :
Numerous positions at the top of this chart are taken by American cities. Strong internal migration trends and rekindled interest from overseas investors are particularly evident in Miami.
Real Estate bubble in Hongkong :
Of all the cities examined, Hong Kong saw the largest nominal reduction over one year. According to the survey, Hong Kong “has generally stagnant since early 2019 as the lack of affordability, economic difficulties, and pandemic limitations all took a significant toll on demand.”
Prices can’t continue to rise indefinitely. According to UBS, price adjustments have started in most locations with high valuations or may be just around the way.
do check out our chart section for more investment related charts.


