

Over the past few years, it has gotten harder and harder for middle-class families to buy a home, and the global epidemic has only made matters worse. The number of property markets throughout the world judged “severely unaffordable” grew by 60% compared to 2019 according to Demographia’s 2022 Housing Affordability Report (prior to the pandemic).Here is the Least affordable housing markets.
In relation to median household income, this graph examines some of the most expensive housing markets worldwide. In eight distinct countries—Australia, Canada, China, Ireland, New Zealand, Singapore, the United Kingdom, and the United States—the research covers 92 different cities.
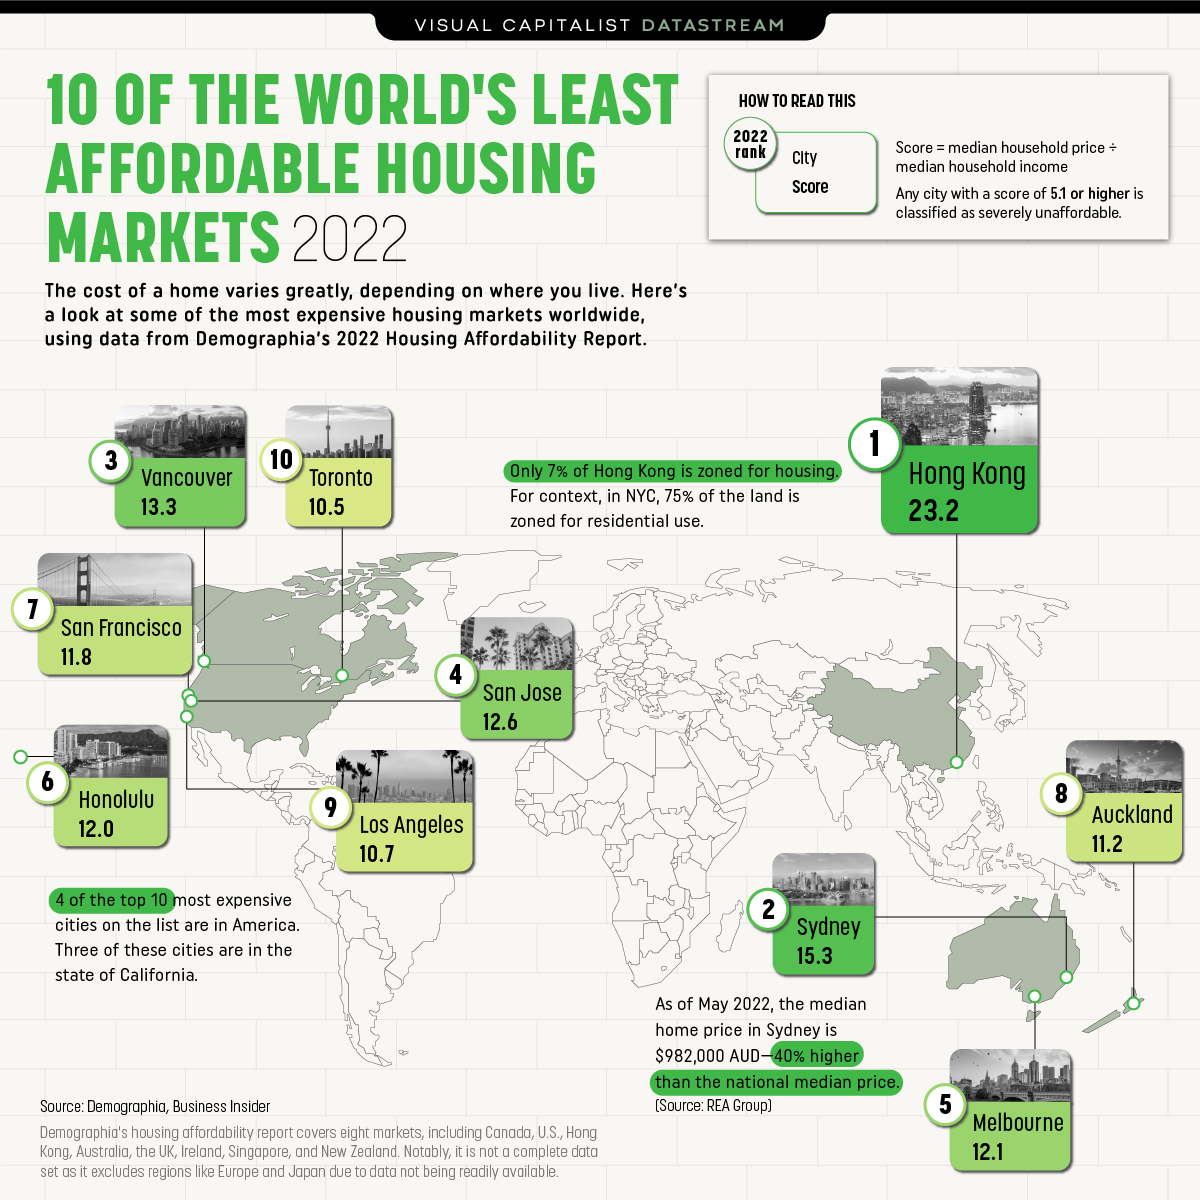
Least affordable housing markets
In order to better understand why the housing market is considered to be very unaffordable, it is important to first briefly describe the methods utilized in this analysis.
The median housing cost in a city is divided by the median household income to determine affordability. Following that, a city receives a score:
A score of 5.1 or more is regarded as being seriously expensive.
4.1 to 5.0 is seen as being dangerously out of reach.
3.1 to 4.0 is seen as moderately out of reach.
All of the cities shown on this graph are categorized as being extremely unaffordable, and Hong Kong, with a score of 23.2, tops the list of the most unaffordable housing markets in the world for the 12th consecutive year.
| Housing Market | Nation | Score |
|---|---|---|
| Hong Kong |  Hong Kong (SAR) Hong Kong (SAR) | 23.2 |
| Sydney, NSW |  Australia Australia | 15.3 |
| Vancouver, BC |  Canada Canada | 13.3 |
| San Jose, CA |  U.S. U.S. | 12.6 |
| Melbourne, VIC | Australia | 12.1 |
| Honolulu, HI | U.S. | 12.0 |
| San Francisco, CA | U.S. | 11.8 |
| Auckland, AUK |  New Zealand New Zealand | 11.2 |
| Los Angeles, CA | U.S. | 10.7 |
| Toronto, ON | Canada | 10.5 |
Because just 7% of the land in the area is zoned for residential use, Hong Kong has a shortage of housing that contributes to the region’s high housing costs. For comparison, residential housing occupies 75% of the land area in New York City.
With a score of 15.3, Sydney climbed one rank this year to take the second-most expensive city on the list to buy a home. In the past 18 years that this study has been published, no other city save Hong Kong has received a score this high.
There are a number of hypotheses explaining Sydney’s skyrocketing housing costs, but according to industry expert Tom Forrest, CEO of Urban Taskforce Australia, the supply isn’t keeping up with demand.
Housing supply has been consistently not meeting demand in the Greater Sydney and across regional New South Wales…if you have supply consistently not meeting demand then the price will go up. That’s what happened and we’re seeing it in abundance.”
TOM FORREST, CEO OF URBAN TASKFORCE AUSTRALIA
The Impact of COVID-19 Fueling the real estate markets
Prior to the global pandemic, middle-class families were already under pressure, but COVID-19 only made housing affordability problems worse.
As more individuals started working from home, demand in suburban areas that were previously relatively affordable increased as high-income workers began to hunt for more spacious accommodation that wasn’t necessarily in the city core.
Supply chain problems and rising material costs both had an impact on construction at the same time, resulting in a perfect storm that ultimately raised housing prices.
But some experts are predicting a market slowdown this year—at least in some parts of the world—as interest rates rise and COVID-19 restrictions loosen globally.


