
We have seen some major moves of market in recent days , At the time of writing this blog , year to date(2022) VIX was 53% while S&P500 was -13% .
So what is going on ? answer is simple Market tend to over-react every rate hike cycle of federal reserve . let’s take an example of recent year 2016-18 rate hike cycle.

After enjoying years of low interest rate when Fed decided to raise rates market didn’t took it well it dropped 13%. followed by relief rally of 10% and again touching the bottom with -15% . This cycle continued for 8 months. You can see that in above chart in grey zone.
During this time market did horizontal move , Similar to what is going on now, Raising only the blood pressure of investors but not the Profit.
So how long will be this horizontal move ?
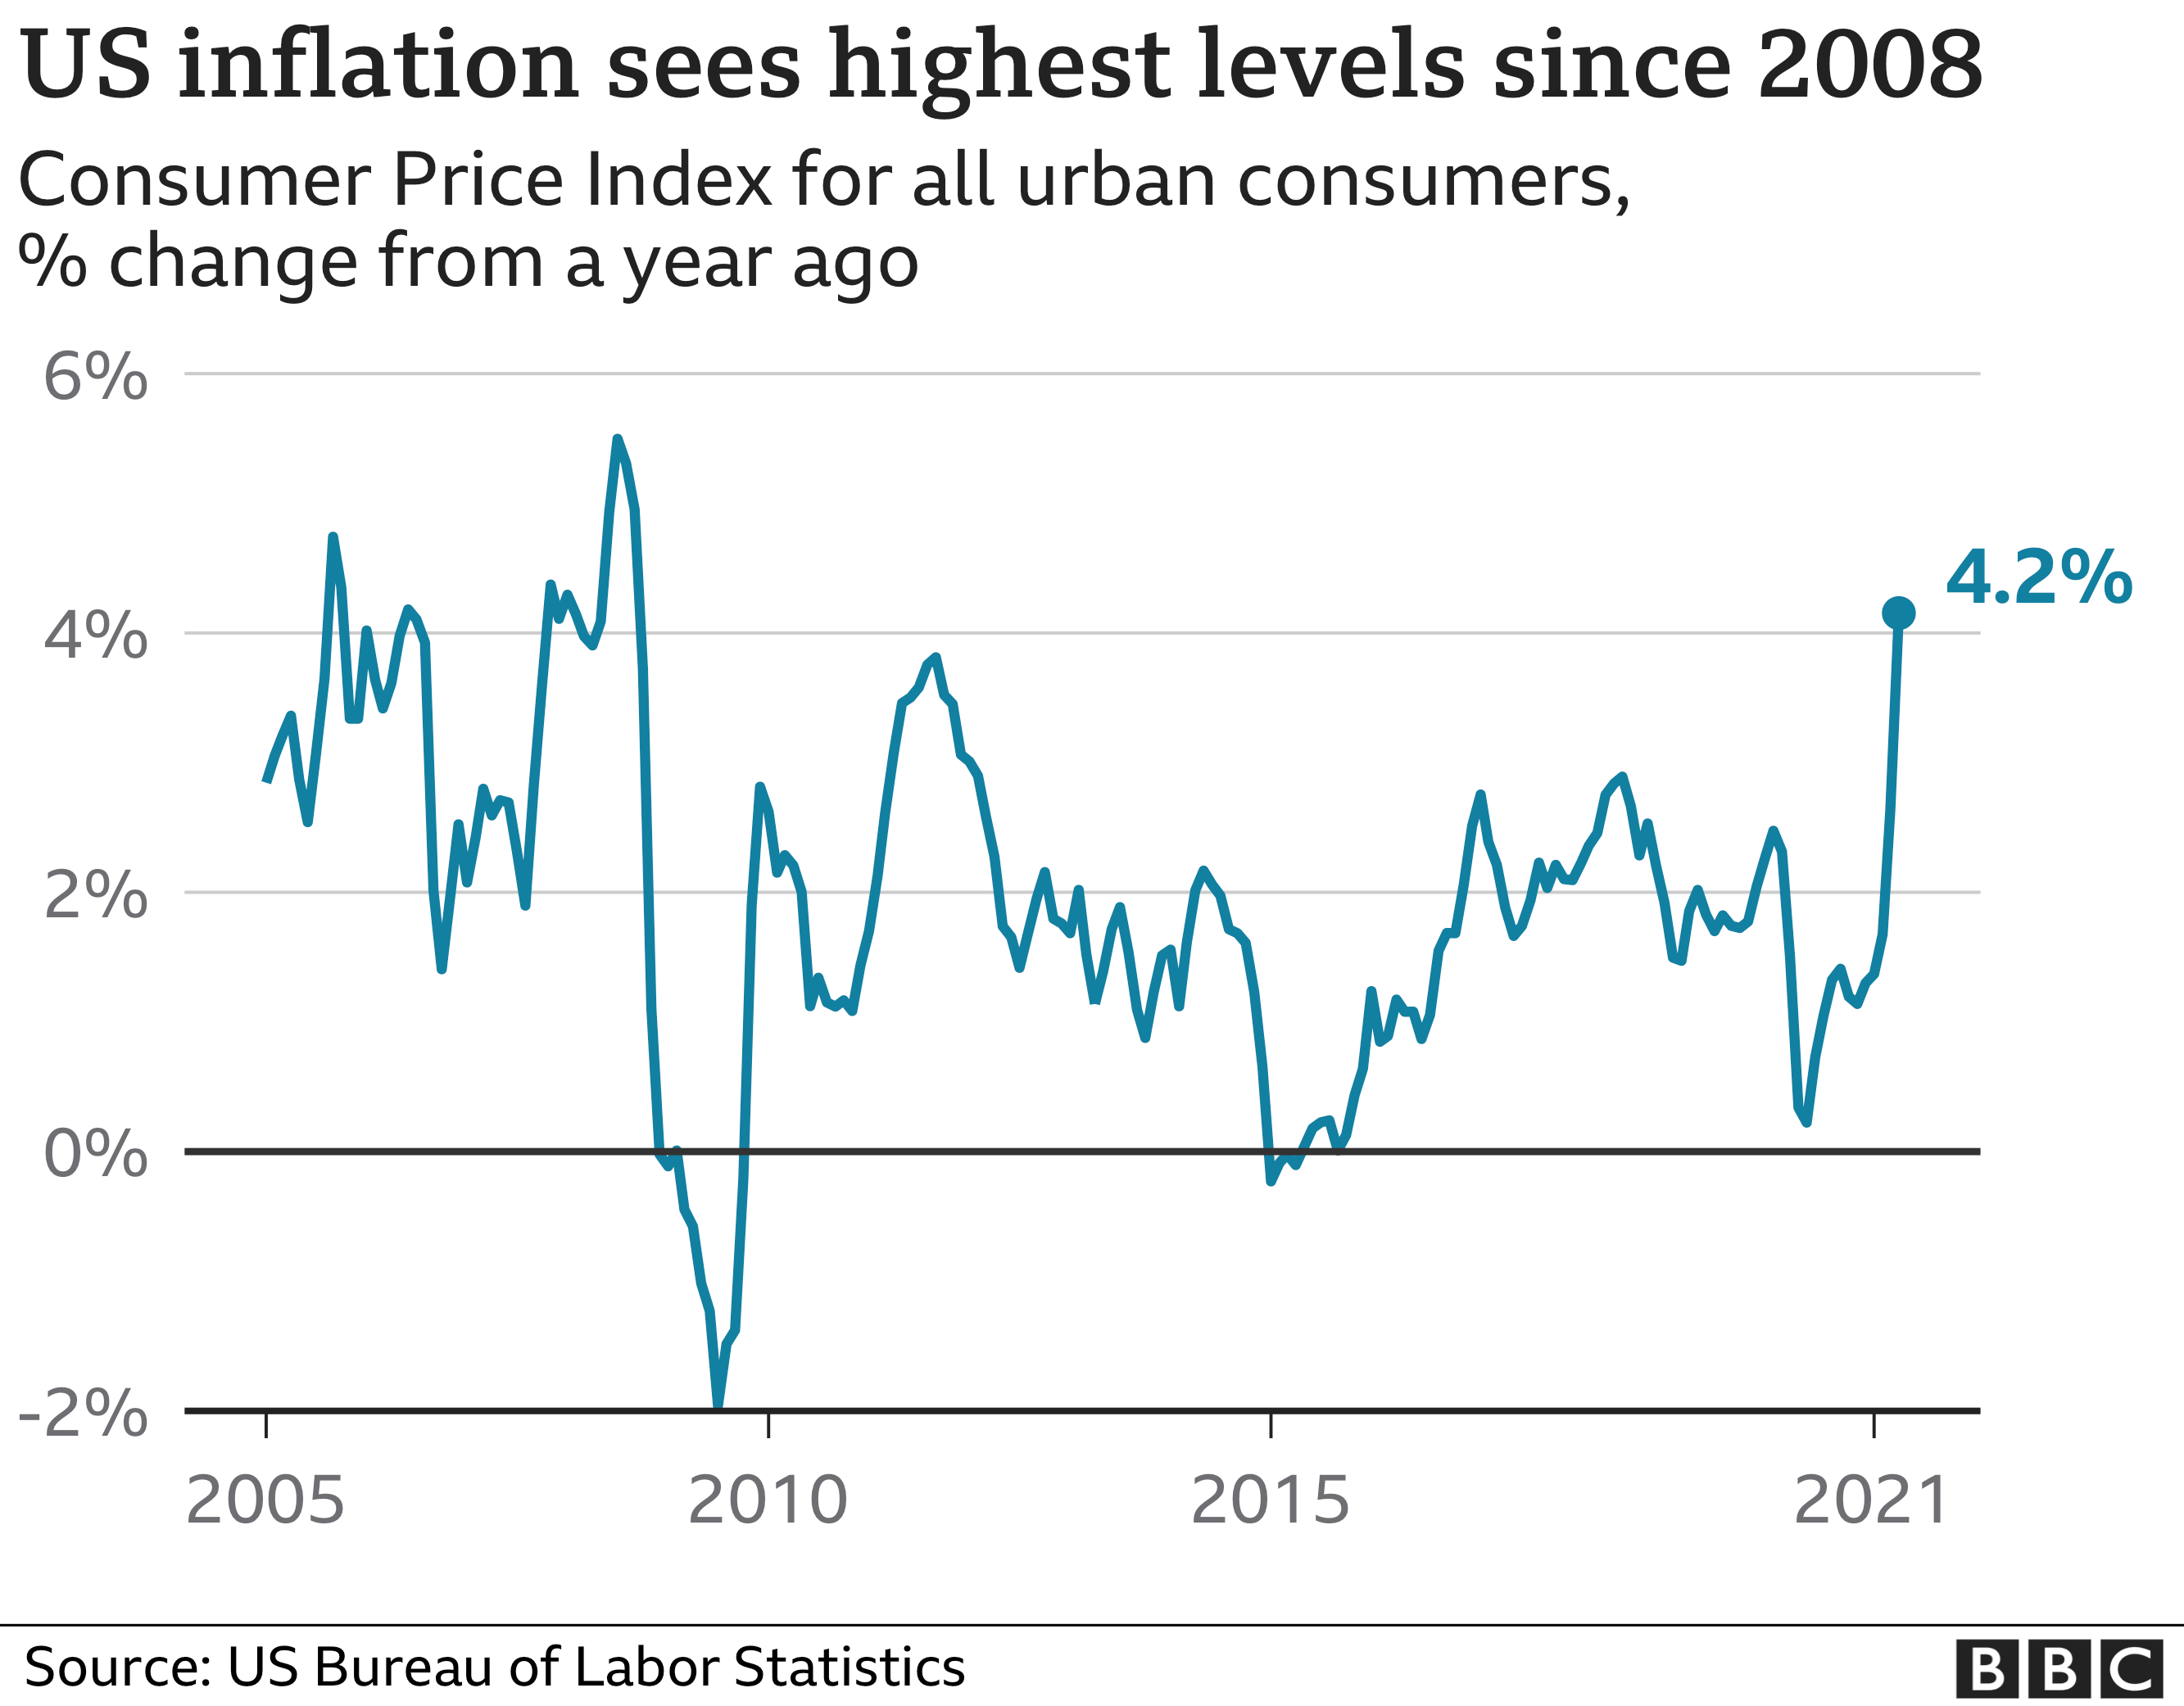
Answer is not that simple, During year 2016 Oil price was ranging between 40-60 USD while now it is 100+. US inflation was ranging between 2-4% while now it is between 6-8%.
But Not all is bad, if we look at the job numbers it shows economy is still strong and we have record job openings. better then year 2016-18 and almost pre-pandemic levels. Below chart shows unemployment rates. We are now at 3.8% .

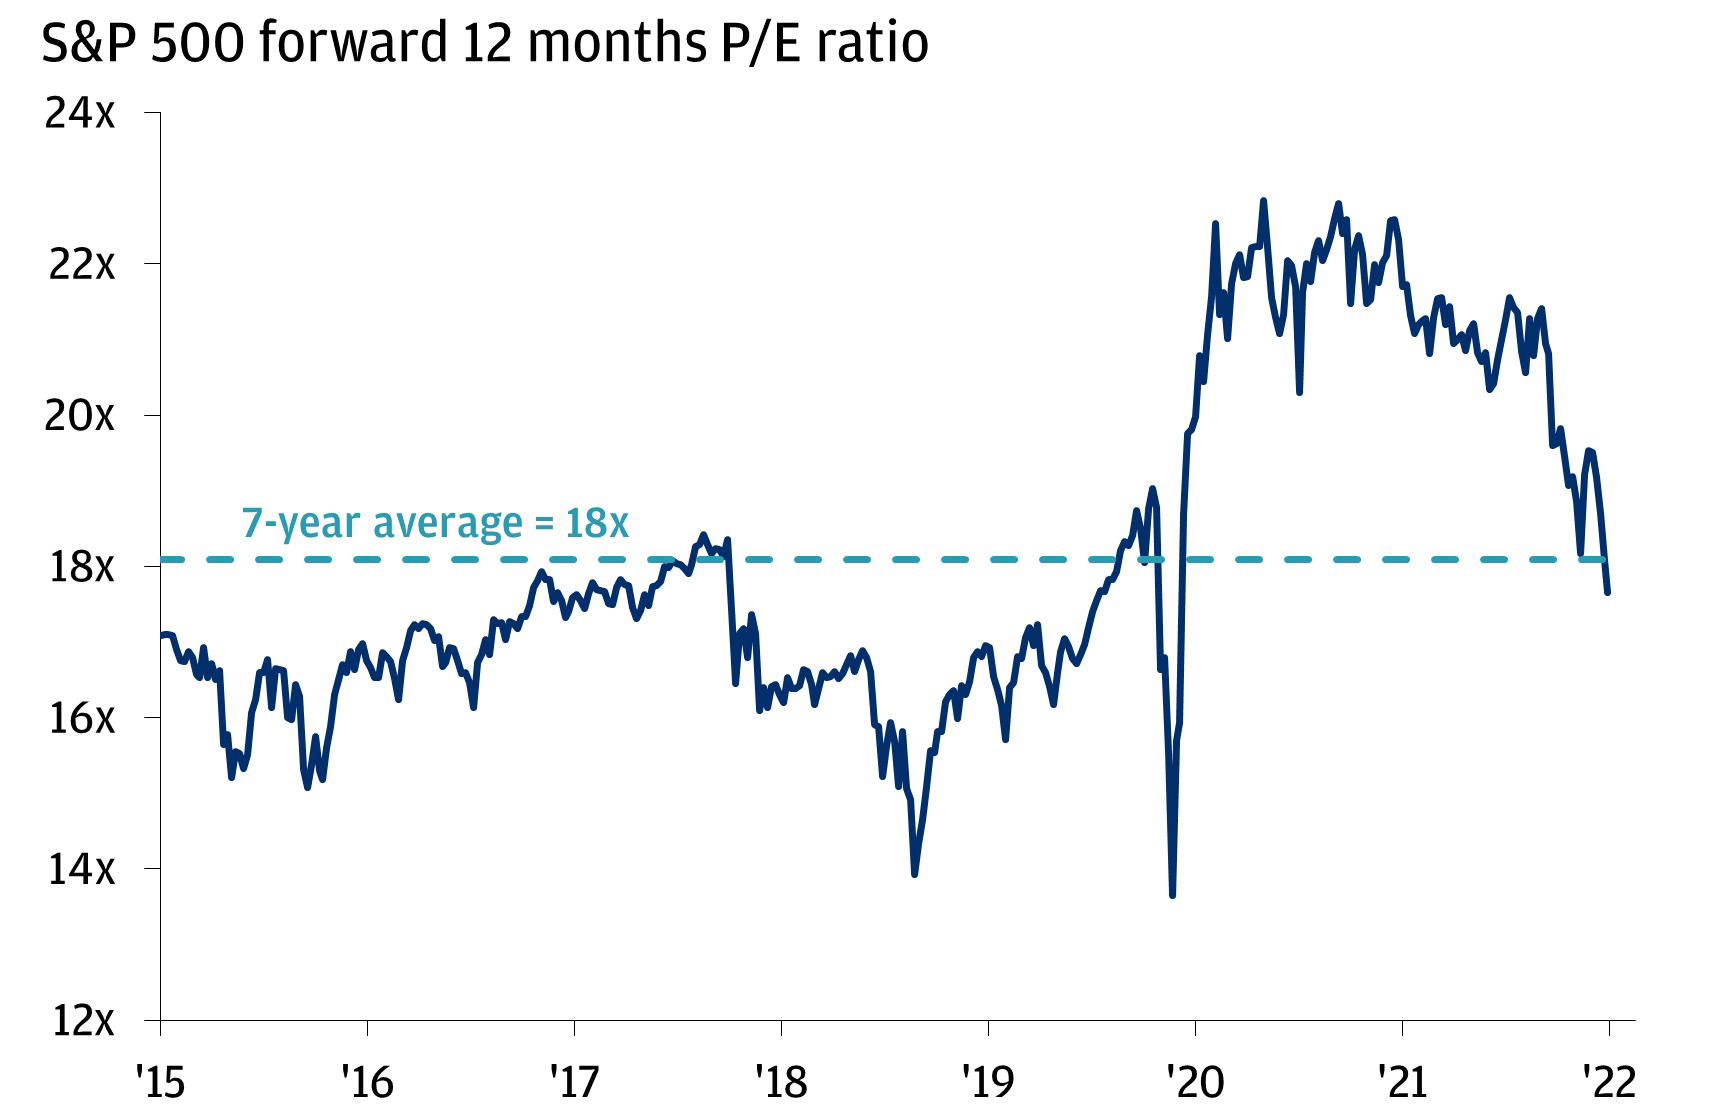
what about P/E and Valuation ?
Investors have been dealing with a valuation issue since the middle of 2018. On the one hand, equities valuations (in this piece, we’ll focus on the price-to-earnings ratio) were historically high, while “risk-free” bond yields were historically low.
Now is totally different situation :
Let’s begin with stocks. The decade is a good time frame to use because it encompasses a variety of macroeconomic settings while also allowing for a consistent comparison of the many types of companies that make up the S&P 500. Financials and energy firms, which naturally trade at lower price-to-earnings values due to their more cyclical earnings, comprised up a quarter of the S&P 500 ten years ago. Those two industries now account for only 15% of the economy. The S&P 500 is currently trading at an 18x price-to-earnings ratio, which is exactly the average over that seven-year period. We believe that corporate earnings (which drive stock values over time) will continue to rise steadily. For the first time in a long time, It is cheaper .
So to answer how long it will take to breakout i can give you 2 cases.
case1 😟 : if you think there will be recession in that case you are looking at 2-3 years of horizontal move.
Case 2 😊: if you think we will survive with the minor recession and FED will pull of soft landing in that case S&P500 is ready to breakout in coming months or a year.
my 2 cents are on Case no.2. What ever you choose in long run Market will not disappoint us. so Ride these unpleasant months out with out losing your hair.
You can also check out our other article :
We also post on twitter regularly.


