

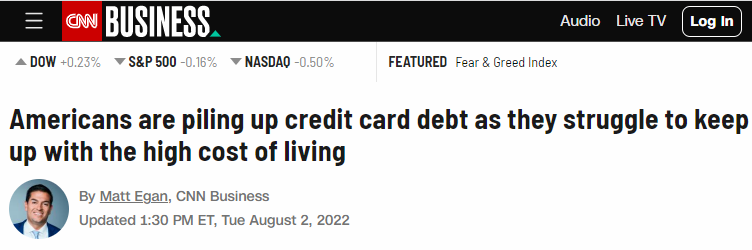
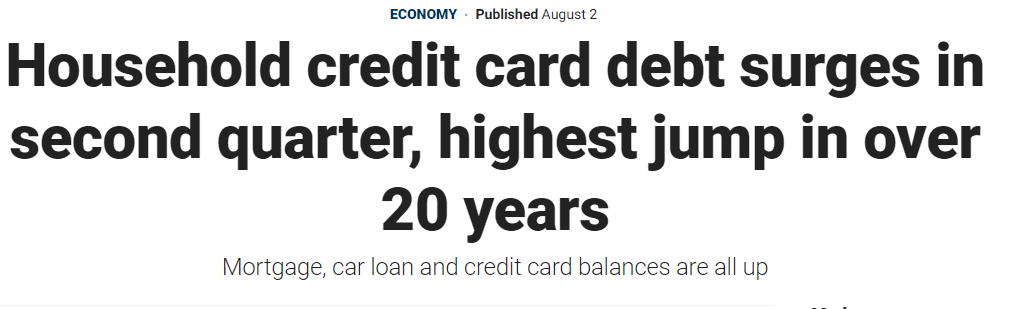
The total amount of consumer debt is at an all-time high. The worst type of debt by far has seen a significant increase, with credit card balances rising by 13% year over year.
This is not good.
Ready the ominous headlines?
I’ll make an unarguable claim right now: credit card debt is bad. The prices are shocking. One of the worst decisions you can make regarding your personal finances is not paying off your credit card bill.
But are things as bad as they appear in the headlines?
Let’s examine the statistics.
The evolution of consumer debt’s composition is shown here:
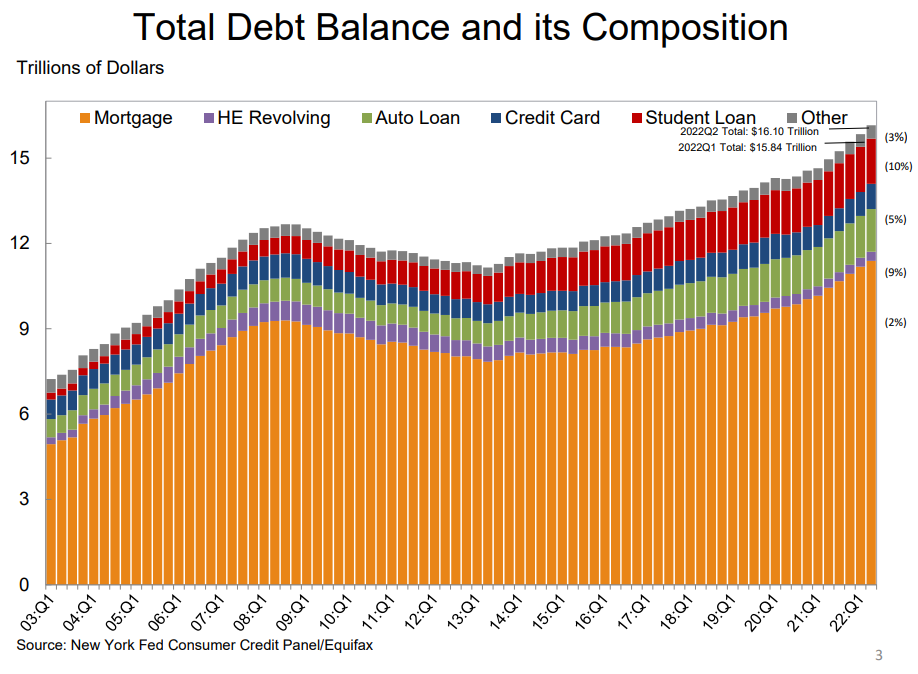
Mortgage debt is by far the largest portion, as can be seen over time, which makes sense. Student loans have experienced the most growth in market share, going from accounting for 3% of all consumer debt in 2003 to almost 10% now.
Look at credit card debt as a percentage of the total; it has been consistently between 8 and 9% of the total for many years.
The total amount of credit card debt at each quarter’s end since 2003 is shown below:
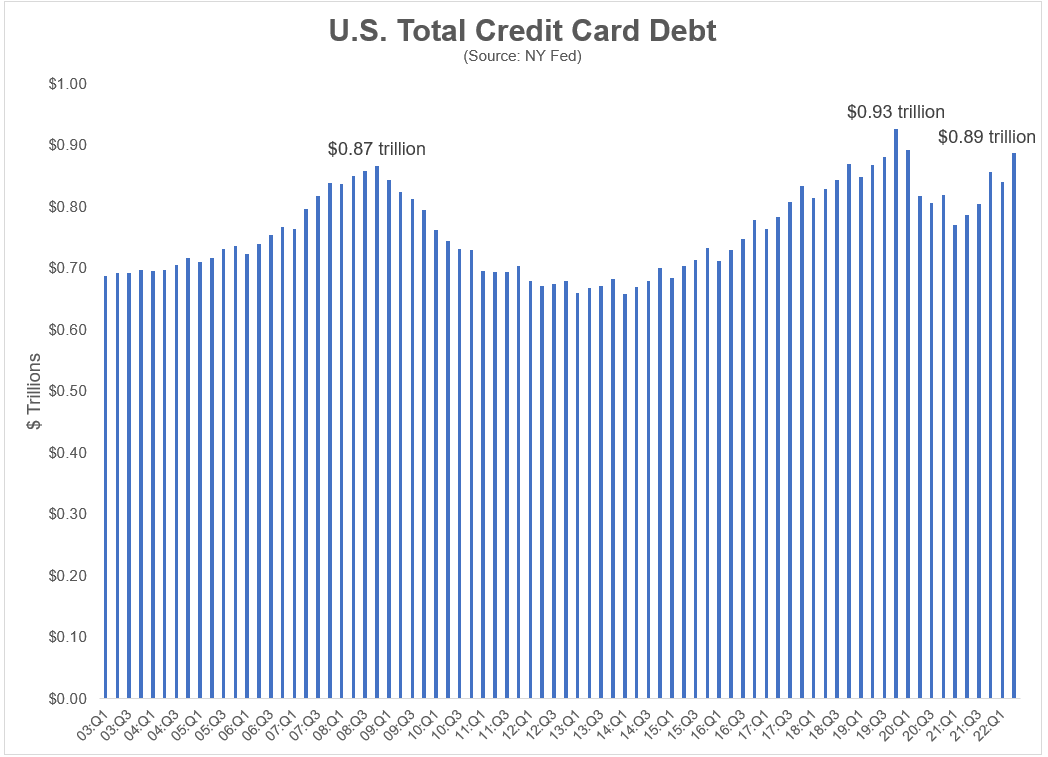
Although credit card debt is rising, it is still lower than its pre-pandemic peaks. In actuality, credit card debt is hardly higher now than it was in the fourth quarter of 2008. The total amount of credit card debt has essentially not increased in the past 15 years.
This is as a result of American households strengthening their balance sheets in the wake of the 2008 financial crisis. Once the pandemic started, they did it once again.
Yes, inflation is likely a major factor in the increase in credit card debt, but people are also likely resuming their normal purchasing patterns.
Some may find it surprising, however since 2003, the rise in credit card debt has largely followed the rise in the consumer price index:
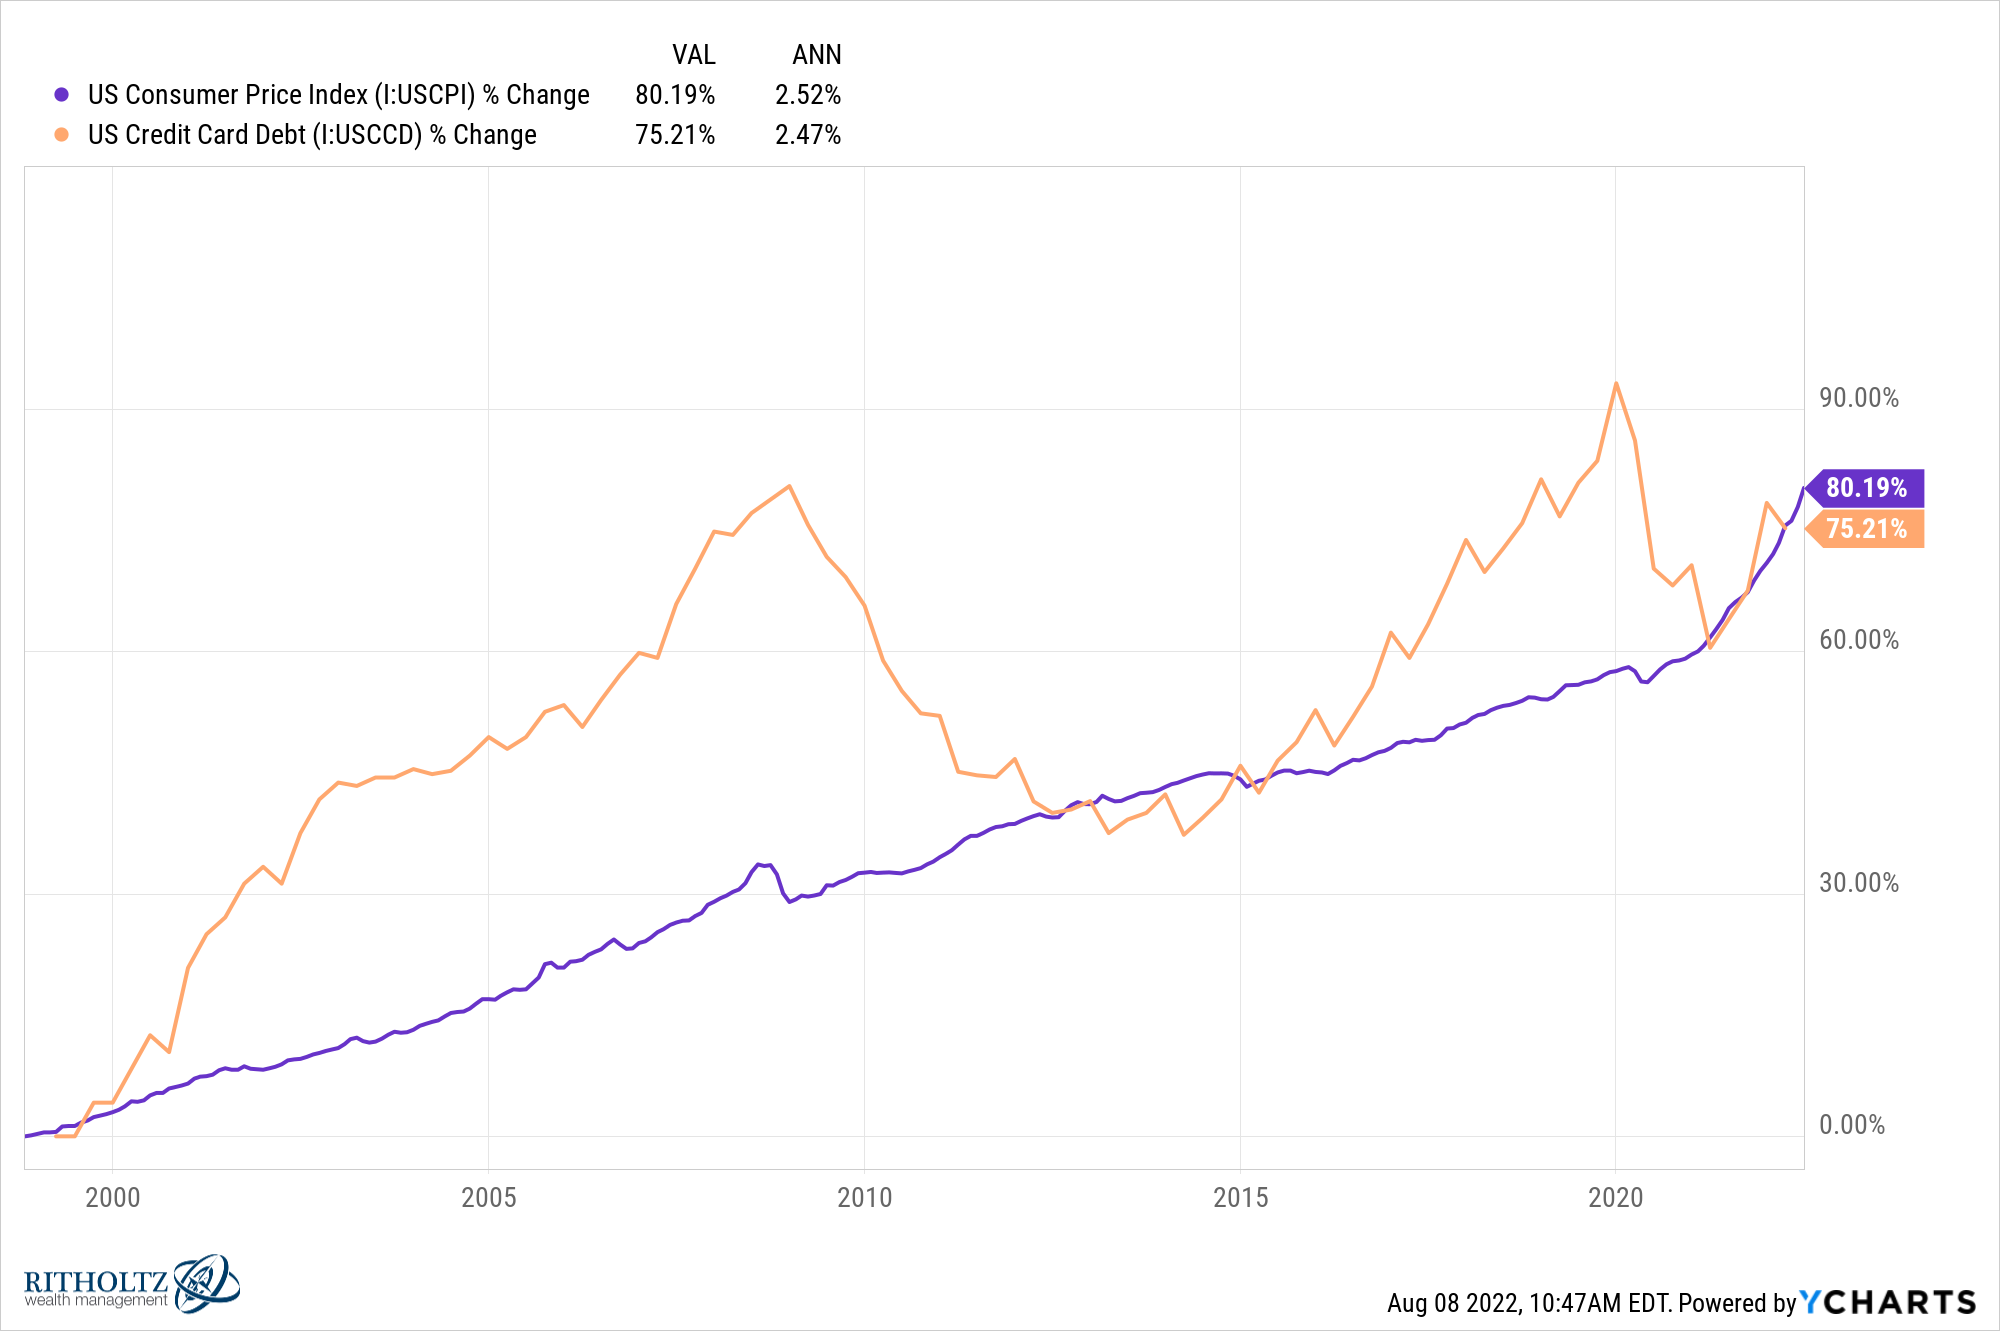
Both are up by about 2.5% annually during that time. Although it isn’t ideal, in the long run, the connection is pretty darn close.
Credit card usage appears to have increased about as much as prices over the previous 20 years, far from being some runaway debt train.
Now consider the most recent delinquency figures:
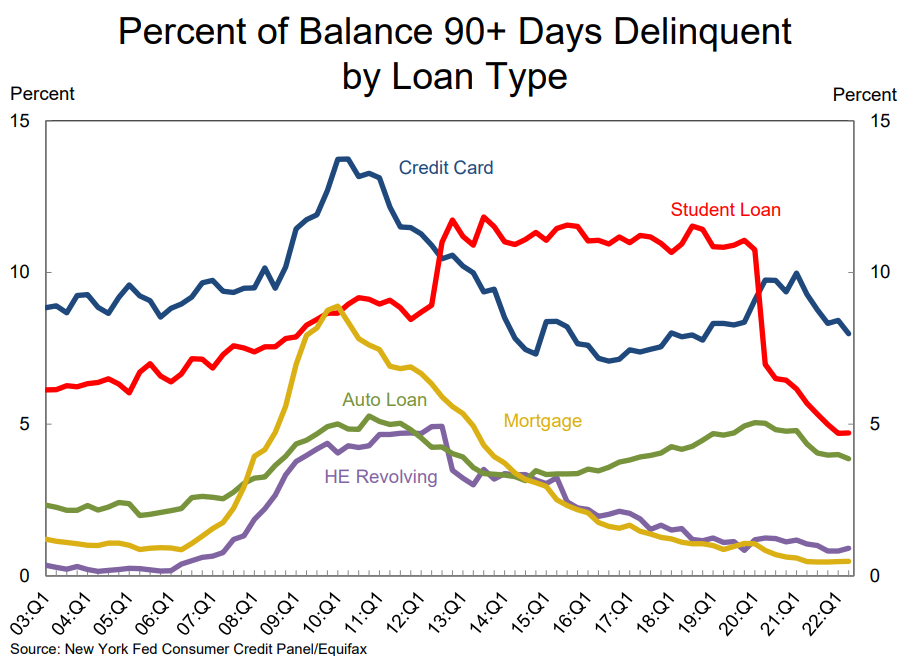
Although the overall levels of credit card debt are rising quickly, it doesn’t seem like the majority of borrowers are now taking on more than they can handle.
We’ve just examined the debt side of the problem thus far.
What about the resources and earnings that help to pay off the debt?
Our inability to interpret numbers in context is known as denominator blindness. When talking about sums in the billions or trillions of dollars, this is especially true. Big figures don’t always convey the complete picture.
Here is an illustration of household debt service as a proportion of available income:
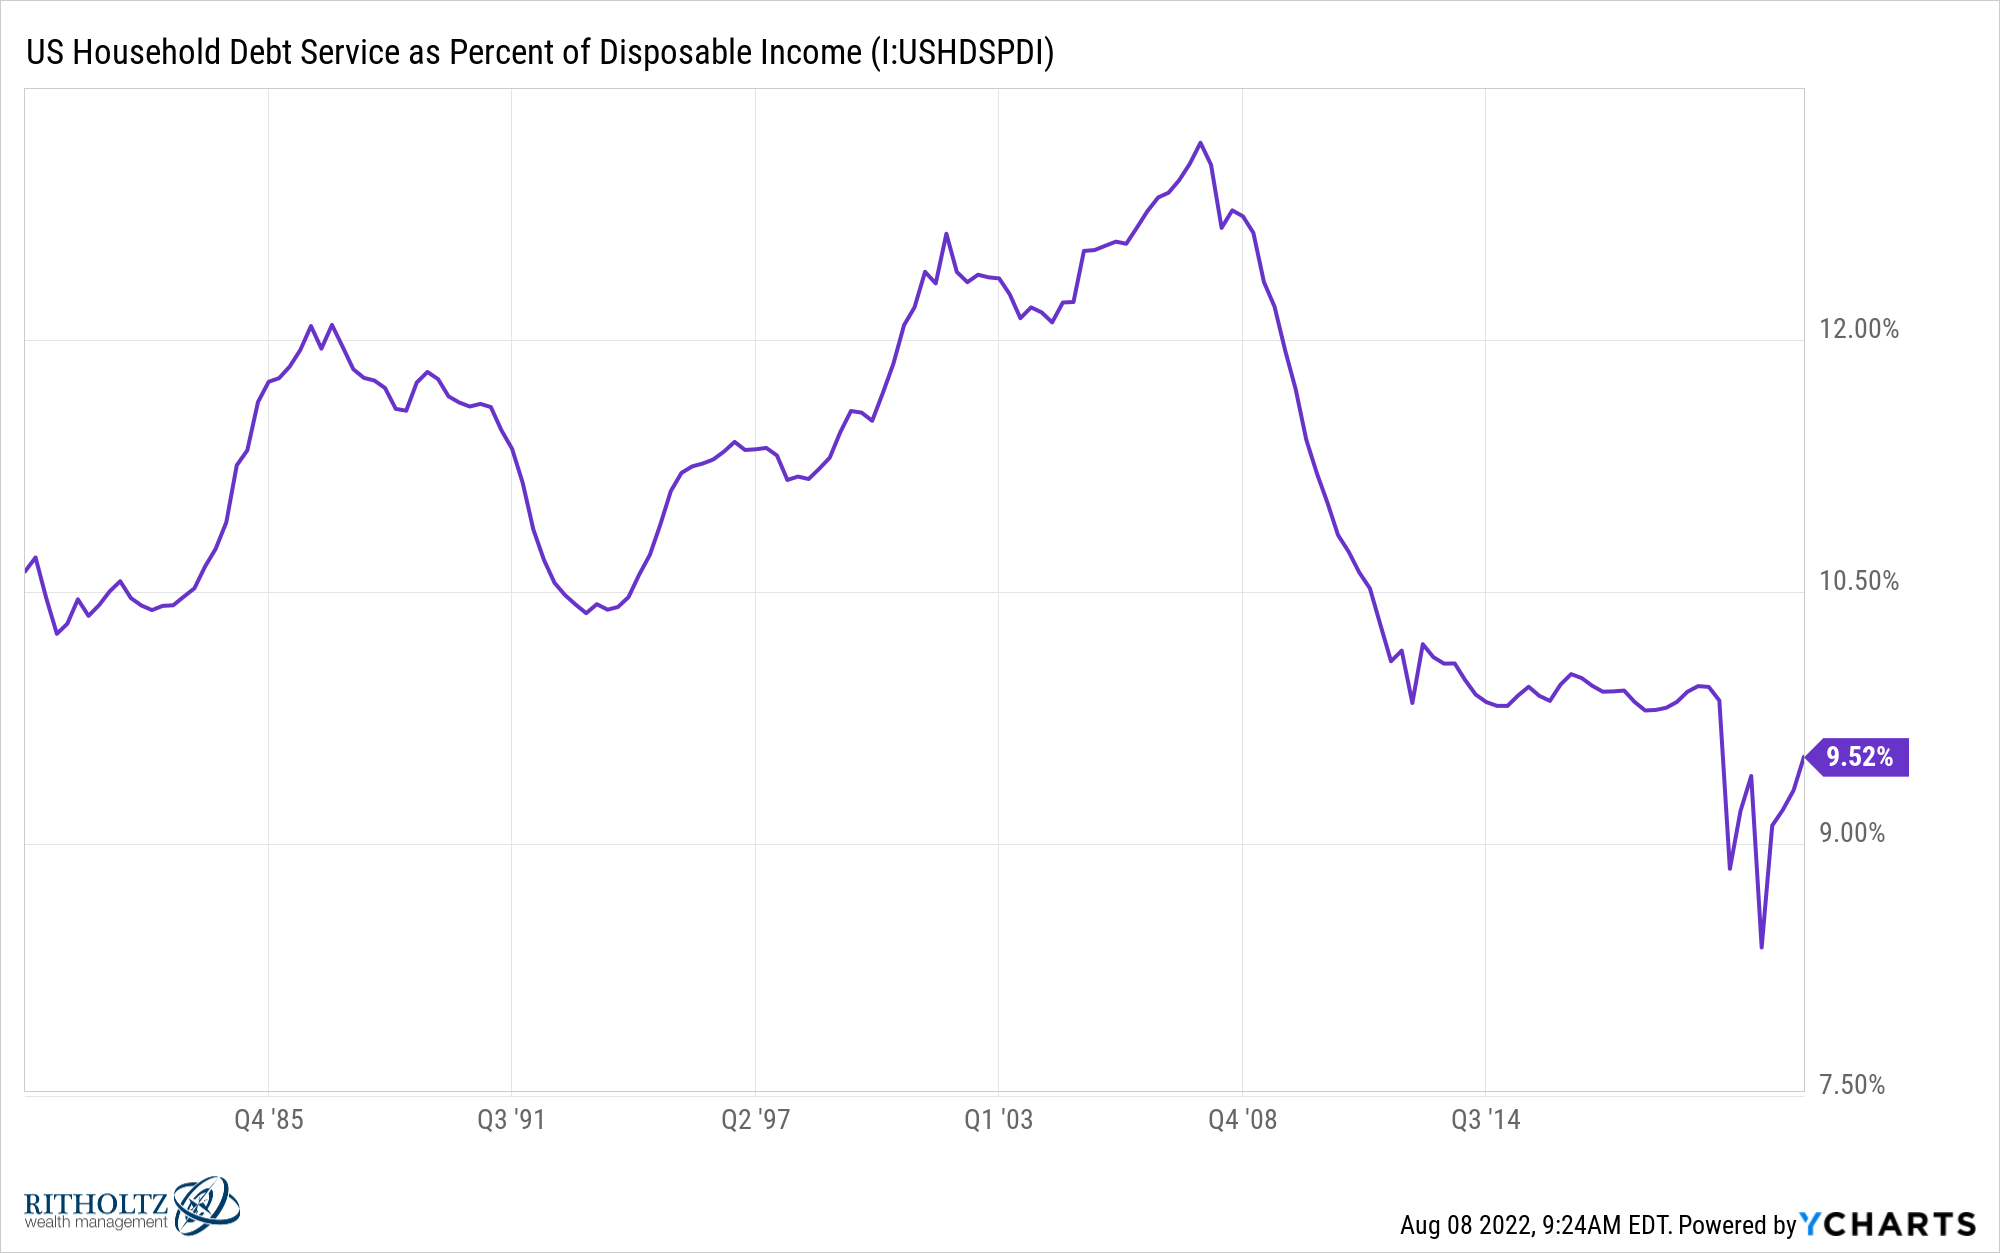
Given that mortgage debt makes up around 70% of all consumer debt and mortgage rates have been historically low in recent years, this one makes sense. Although interest rates are higher now than they were in the 1980s and 1990s, I would anticipate this one to increase as well. Those levels were much lower for customers to deal with.
Comparing total consumer debt to financial assets makes the situation even better:
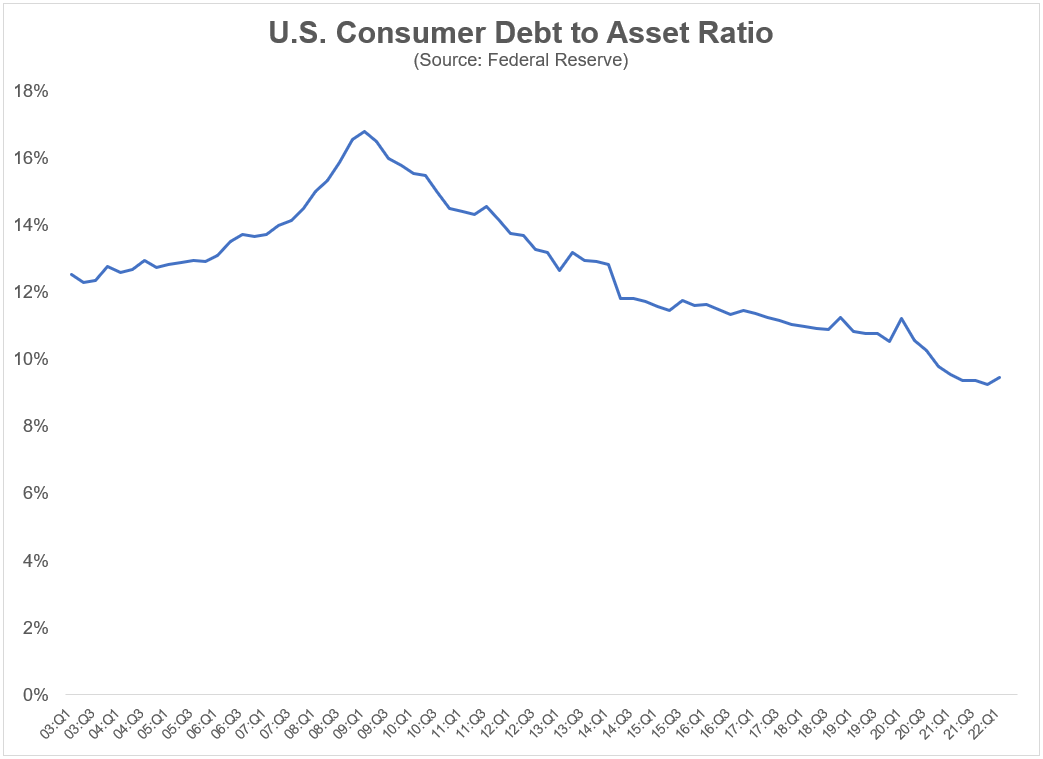
Since the collection of this data began in 2003, this ratio is essentially at its lowest point ever. Debt has increased, while overall wealth has increased at a much higher rate.
Simply said, people are wealthy now.
Although not all households have an identical ratio of debt to assets, overall, American consumers are in a decent situation.
The home market is the same way.
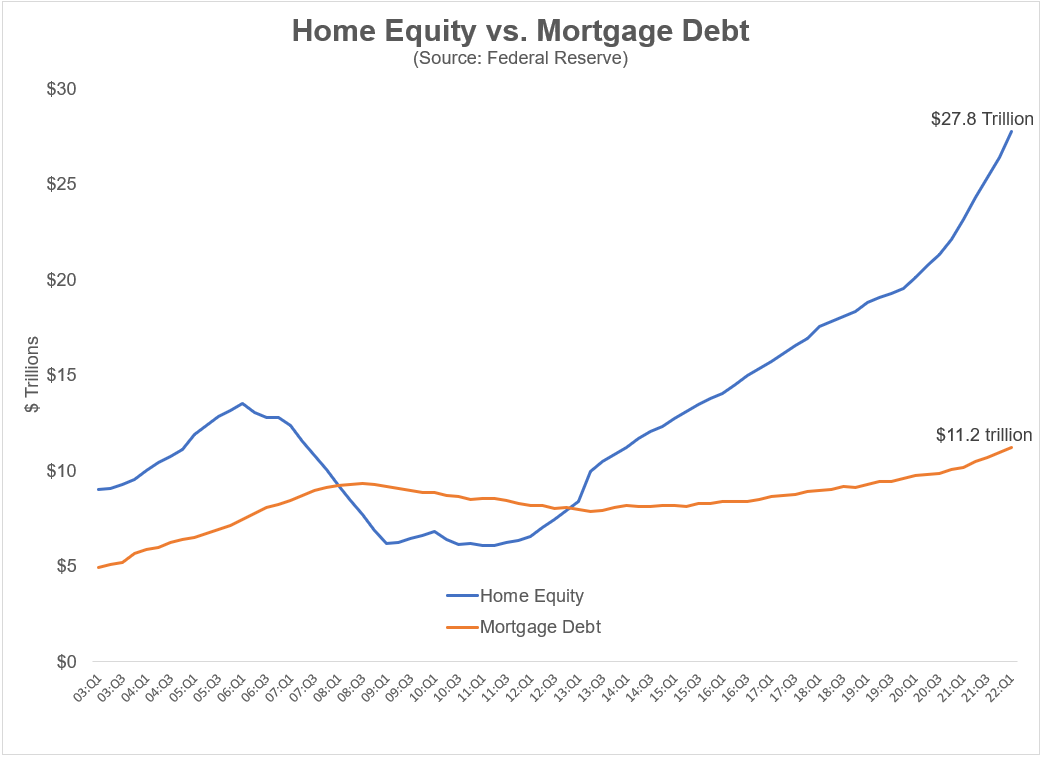
Although mortgage debt is larger, homeowners’ current home equity outweighs those loans.
These connections aren’t fixed in stone. They are quick to flip. You might anticipate that these ratios might worsen if we have a severe recession. It functions somewhat in that way.
But when you put debt levels in perspective, they are not currently concerning.
Even though household finances are far from ideal, the world is not now coming to an end.


