
Many investors believe that certain times of the year are better for equity markets.
Is there any validity to these assertions, or are they mere superstitions? This infographic investigates using data acquired by Schroders, a British asset management organization.
This analysis is based on the performance of four major stock indexes during a 31-year period:
The FTSE 100 is a stock market index that measures the performance of the top 100 businesses listed on the London Stock Exchange (LSE)
MSCI World is a developed market index that includes over 1,000 large and mid-cap businesses.
The S&P 500 is a stock market index that tracks the 500 largest firms in the United States.
Eurostoxx 50 is a stock market index that tracks the top 50 blue-chip stocks in the Eurozone.
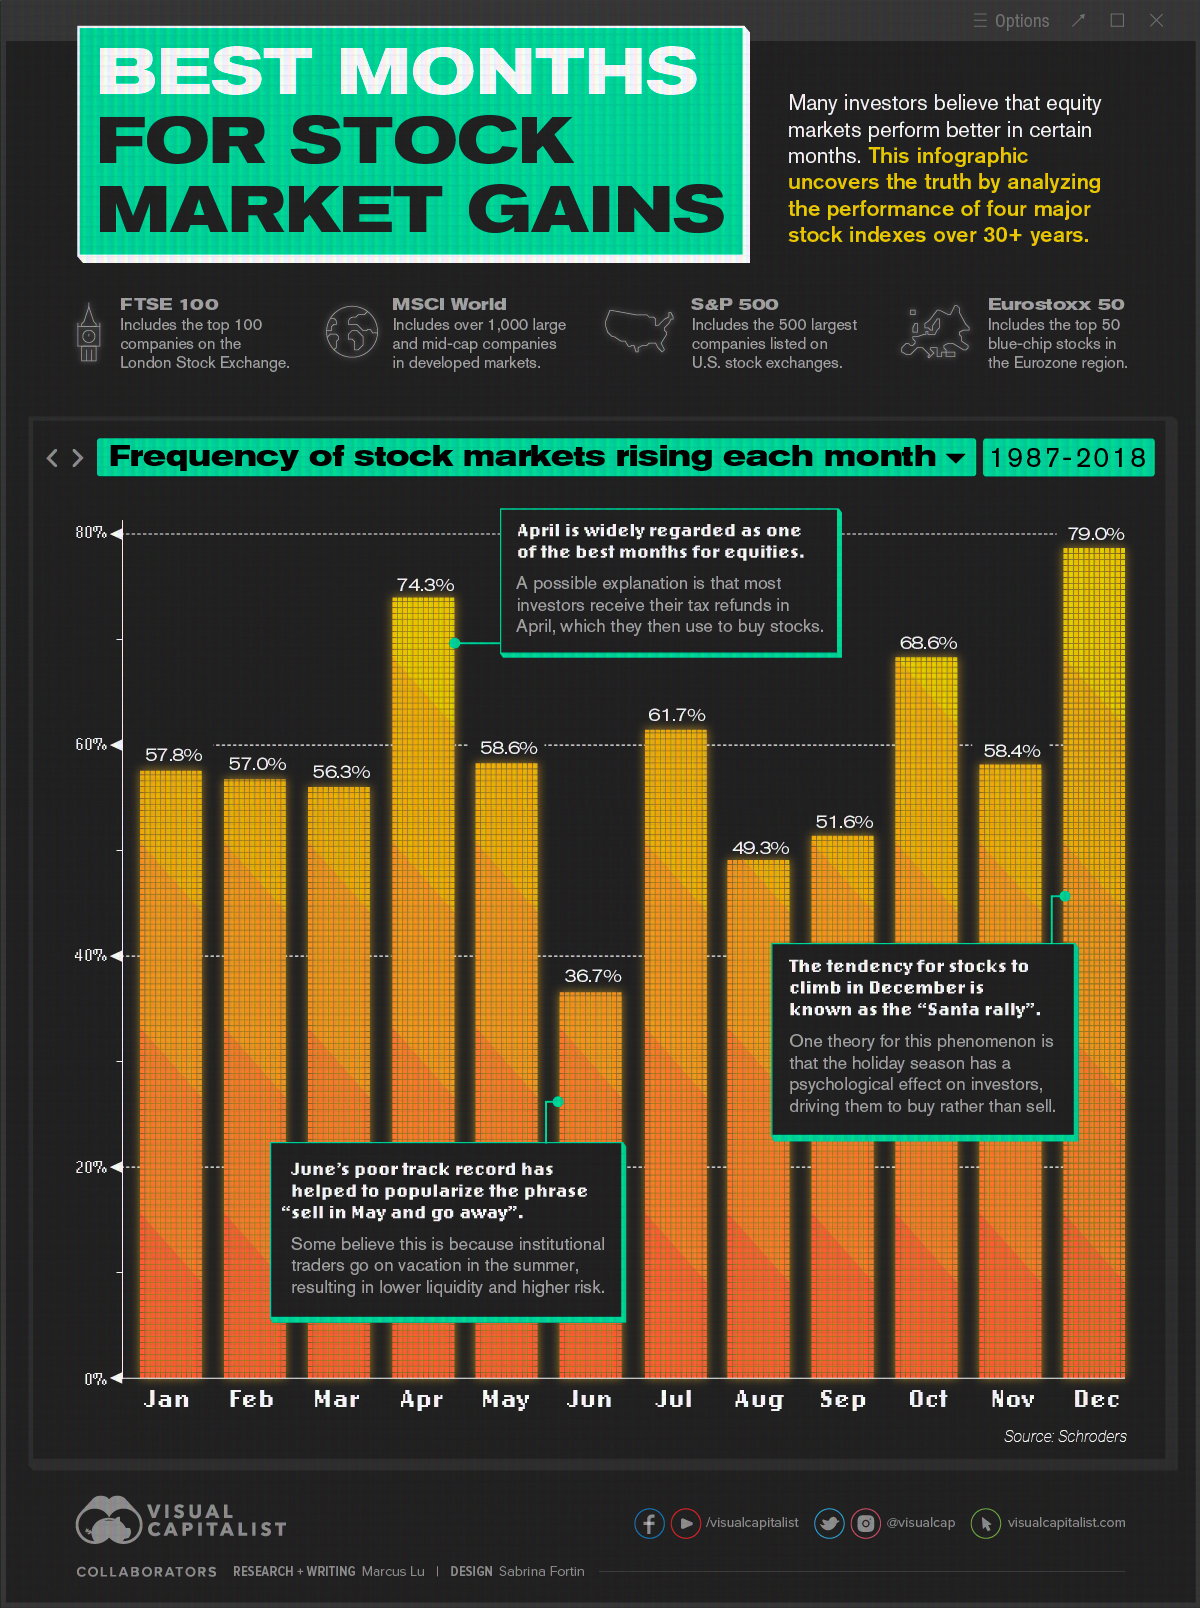
Between 1987 and 2018, the percentages in the following table indicate the historical frequency of these indexes advancing in a given month. Months are listed in descending order from greatest to worst.
| Rank | Month of Year | Frequency of Growth (%) | Difference from Mean (p.p.) | |
|---|---|---|---|---|
| #1 | December | 79.0% | +19.9 | |
| #2 | April | 74.3% | +15.2 | |
| #3 | October | 68.6% | +9.5 | |
| #4 | July | 61.7% | +2.6 | |
| #5 | May | 58.6% | -0.5 | |
| #6 | November | 58.4% | -0.7 | |
| #7 | January | 57.8% | -1.3 | |
| #8 | February | 57.0% | -2.1 | |
| #9 | March | 56.3% | -2.8 | |
| #10 | September | 51.6% | -7.5 | |
| #11 | August | 49.3% | -9.8 | |
| #12 | June | 36.7% | -22.4 | |
| Average | 59.1% | n/a |
The Bull Months
December has historically been the strongest month to invest in stocks in terms of growth frequency. This corresponds to the “Santa Claus Rally,” which claims that stock prices rally around the holidays.
The holiday season, according to one idea, has a psychological influence on investors, causing them to buy rather than sell. We might also assume that a large number of institutional investors are on holiday at this time. This might offer bullish ordinary investors more control over the market’s trajectory.
April, which is traditionally seen as a strong month for the stock market, came in second. Many investors receive their tax refunds in April, which they then utilize to buy stocks, according to one theory. As a result of the flood of cash, prices rise.
When it comes to increased costs, we may also consider the trend in terms of returns. Looking at the S&P 500 since 1928, April has produced an average return of 0.88 percent. This is significantly higher than the monthly average of 0.47 percent.
The Difficult Months
According to this data, the three worst months to own equities are June, August, and September. Is it just a coincidence that they all happen to be in the summer?
Institutional traders are on holiday, as they were in December, which could explain the season’s relative weakness. The market, on the other hand, is less bubbly without the holiday enthusiasm, and the diminished liquidity leads to heightened risk.
Whether you accept it or not, the data clearly shows a pattern. The expression “sell in May and go away” has been famous as a result of this.
Important Points to Remember
Investors should keep in mind that this information is based on previous results and should not be utilized to make stock market predictions.
Anomalies like the COVID-19 pandemic in 2020 might have a huge influence on the world and the stock market. During certain occasions, stock market performance may diverge significantly from the historical averages shown above.
Regardless, investors who are trying to comprehend market fluctuations can benefit from this approach. If markets increase without a clear catalyst in December, it could be the famous Santa Claus Rally at work.


