

Let me tell you a story : In April 2002 The founder and CEO of Sun Microsystems, Scott McNealy, spoke to a gathering of investors. Nearly a year had passed since the dot-com boom burst, which lost investors trillions of dollars.
Investors who purchased Sun Microsystems at a P/S ratio of 10x experienced a 95% loss on their investment. McNealy wasn’t shocked by the result:
At 10 times revenues, to give you a 10-year payback, I have to pay you 100% of revenues for 10 straight years in dividends. That assumes I can get that by my shareholders. That assumes I have zero costs of goods sold, which is very hard for a computer company. That assumes zero expenses, which is really hard with 39,000 employees. That assumes you pay no taxes on your dividends, which is kind of illegal. And that assumes with zero R&D for the next 10 years, I can maintain the current run rate. Now, having done that, would any of you like to buy my stock at $64? Do you realise how ridiculous those basic assumptions are? You don’t need any transparency. You don’t need any footnotes. What were you thinking? 🤔
We discuss the risks of stock ownership at 10x P/S because S&P 500 Index Fund owners have unprecedented exposure to these stocks.
The S&P 500’s top 10 stocks account for 29.7% of the index. Just ten stocks receive over a third of every dollar you invest in that index. The ratio of the value-weighted average price to sales is 7.3x.
The biggest factor in this alarming valuation indicator is Tesla’s P/S ratio. It had a concerning P/S ratio of 14.5x and a 2.44 percent weight in the index.
This graph shows that our P/S ratios were at their greatest point since the dot.com bust, with roughly 20% of the index’s equities having a P/S ratio of over 10x.
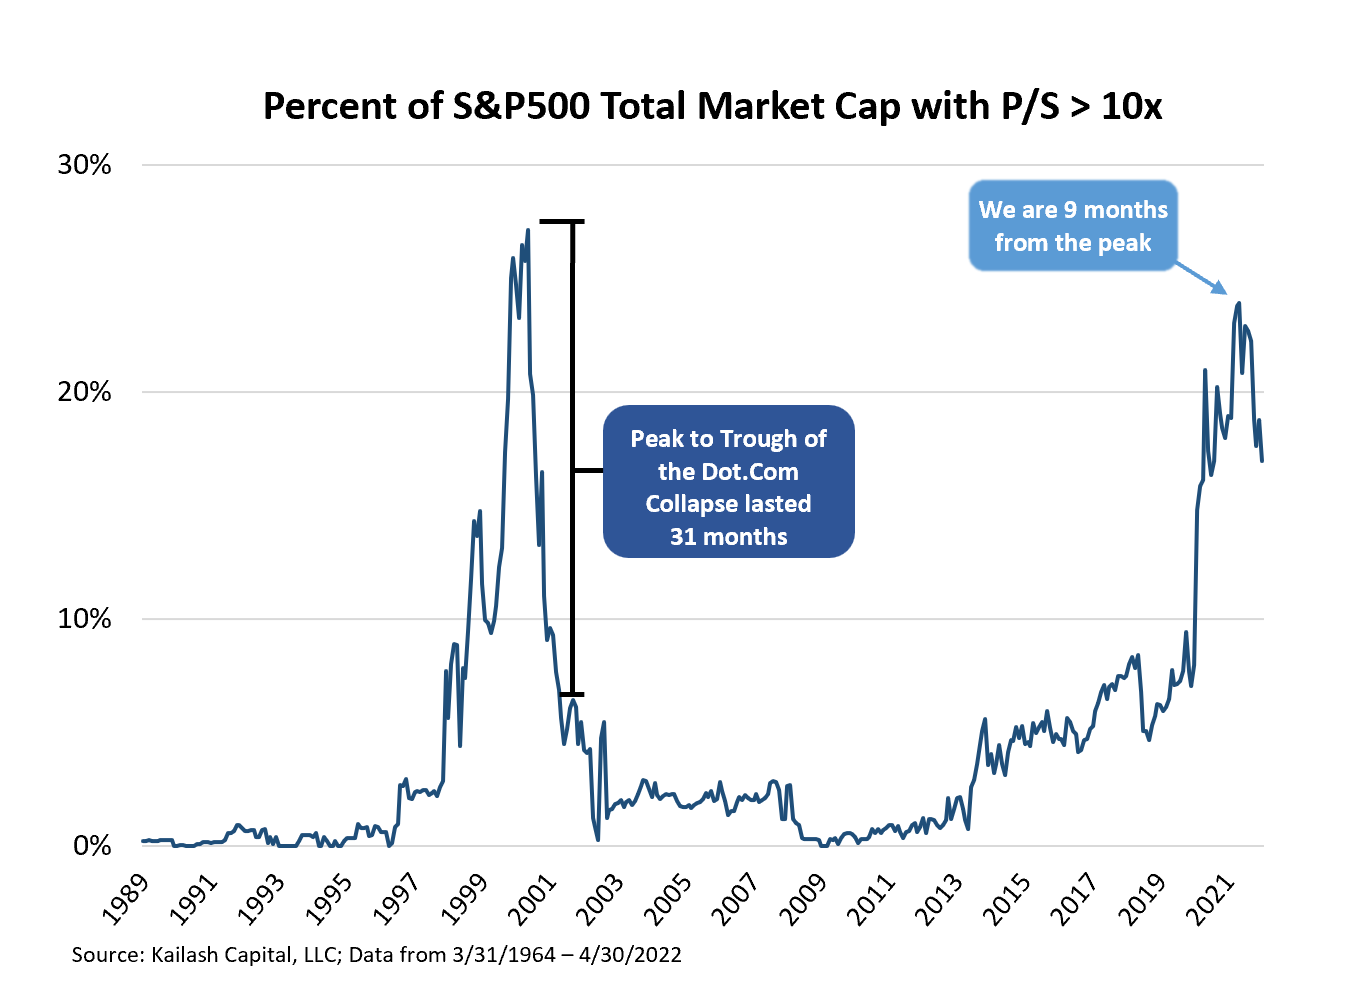
History from Dot-Com bubble
The fate of stocks in the S&P 500 index with a P/S ratio of more than 10x can be predicted based on the dot.com bubble. According to the graph below, those stocks lost 73 percent of their value between February 29, 2000 and September 30, 2002. Only 26% of the value of stocks in the same index with a P/S ratio under 10x was lost.

In that case how to play ?
Here is the table which can help to spot some lights on it:
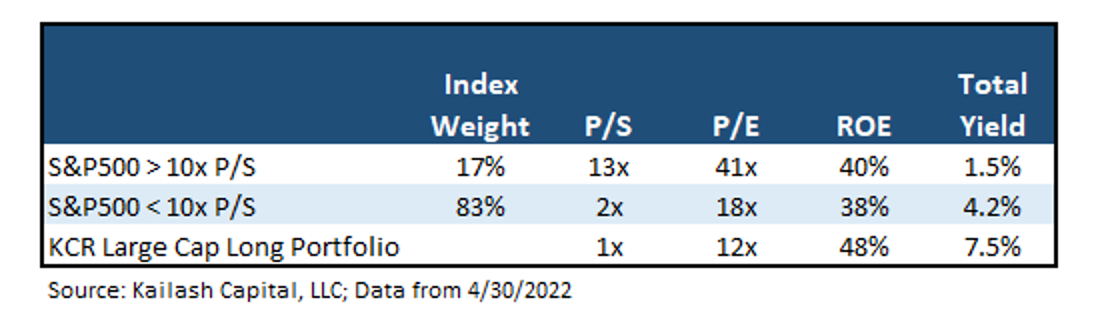
As we see S&P500 gives 4.2% yield if we remove all the stocks with P/S ratio more than 10x ( example Tesla 🤡 ) Which is cheaper and also less risky to hold in bear market.
Do also check out our chart section to get similar chart for your analysis. Don’t forget to book us . we post daily new post and charts.


