
2022 has not had a good start , major indexes around the globes are down double digit, While investors are eyeing on rebound due to recent over sold indicator ( RSI ) , if we look at the below multi-year chart , we might be looking at multi year of correction for nasdaq 100 .
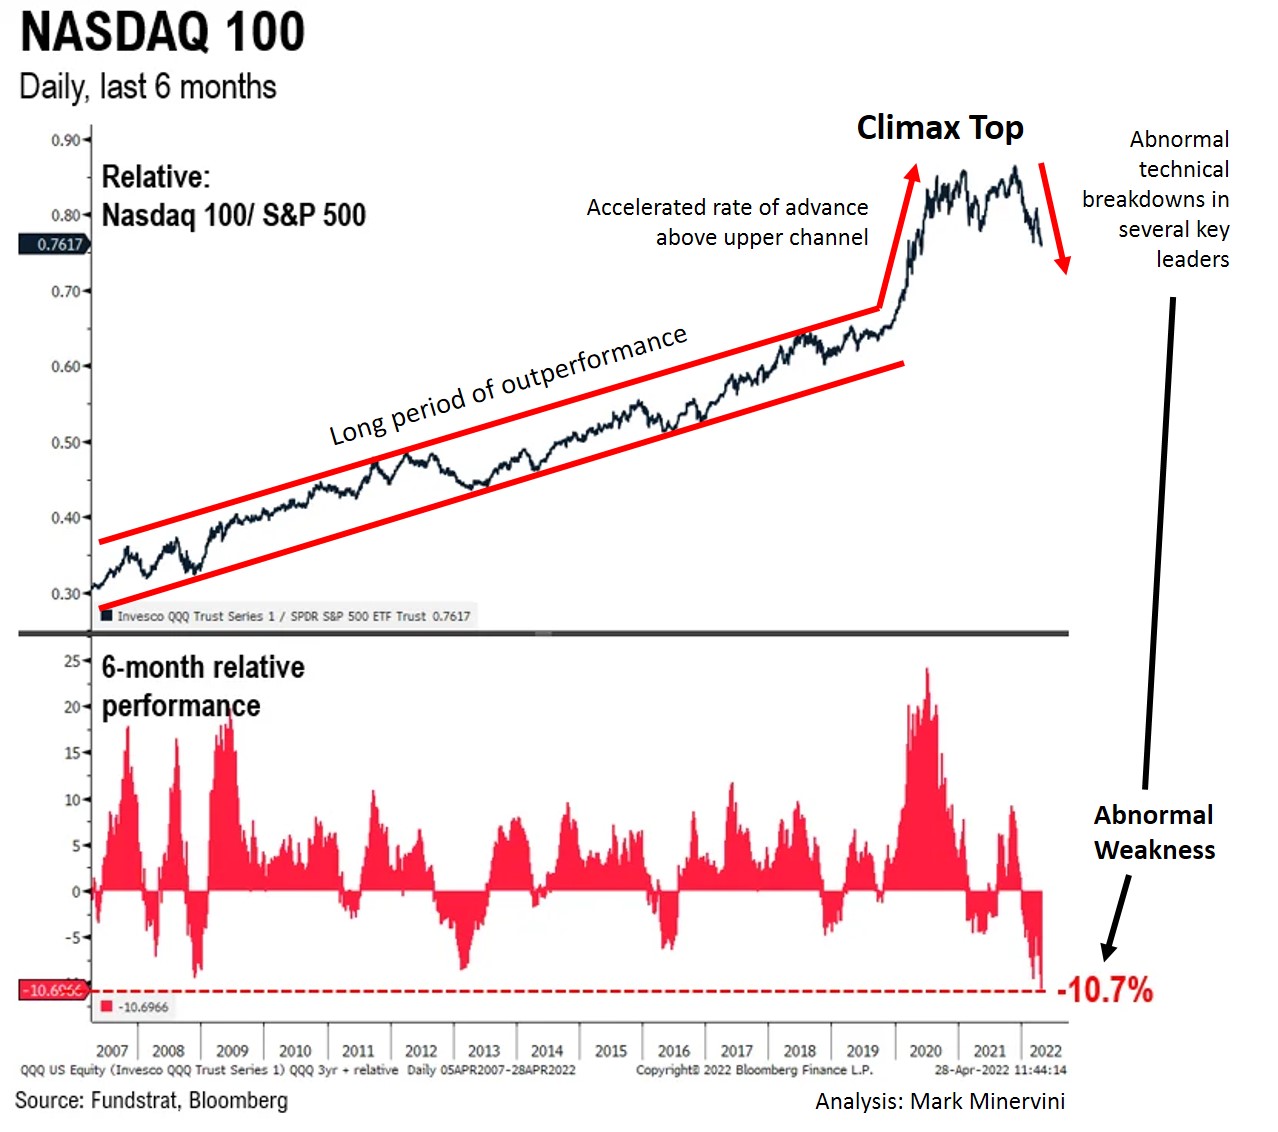
Chart below is Relative : Nasdaq 100 / S&P500
one major difference between these two is Nasdaq 100 holds 60% Technology/Information Tech. While S&P 500 holds 27% of Technology/Information tech.
Let’s agree we have enjoy near zero interest rate from FED for many years, which has helped Tech go sky rocket many might use the word bubble.
If we take non optimistic view we might see more weakness in QQQ and Nasdaq 100 in coming months and year.
Follow us on Twitter
Also check out the chart :
