

Prior to 2022, energy was already a major topic, but rising household energy costs and a cost of living crisis have elevated it even further. Let’s briefly discuss and analyze Global energy production by country , by source – Worldwide
Which nations create the most energy, and what kinds of energy do they produce? The world’s energy production is broken down in this 911 Metallurgist chart, which also reveals which nations have used the most fossil fuels, nuclear power, and renewable energy sources since 1980.
The British thermal unit (BTU), which represents the amount of energy needed to raise a pound of water by one degree Fahrenheit, is used in all calculations.
1. Global energy production from Fossil fuels by Country:
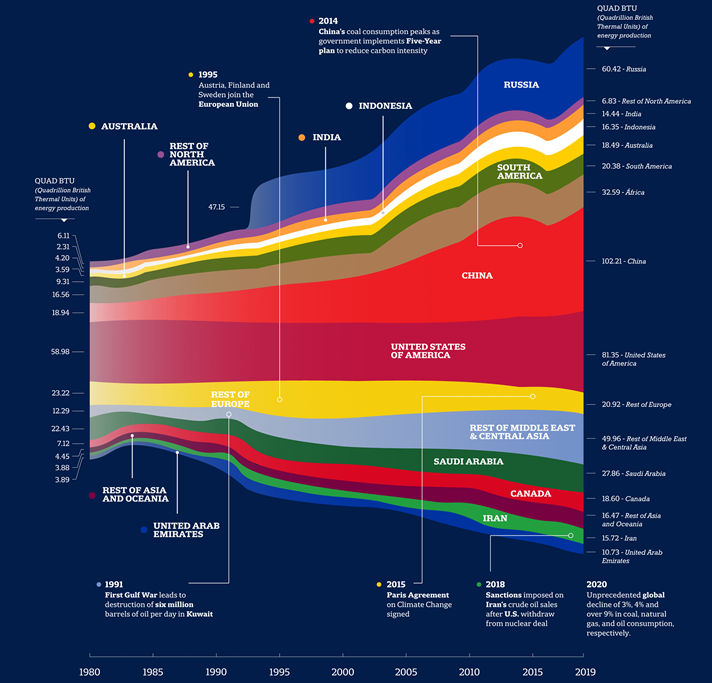
🔥 Energy production by Fossil fuels in QUAD BTU by Country
| Country | QUAD BTU (Quadrillion British Thermal Units) of energy production |
| China | 102.21 |
| United States of America | 81.35 |
| Russia | 60.42 |
| Rest of Middle East & Central Asia | 49.96 |
| África | 32.59 |
| Saudi Arabia | 27.86 |
| Rest of Europe | 20.92 |
| South America | 20.38 |
| Canada | 18.6 |
| Australia | 18.49 |
| Rest of Asia and Oceania | 16.47 |
| Indonesia | 16.35 |
| Iran | 15.72 |
| India | 14.44 |
| United Arab Emirates | 10.73 |
| Rest of North America | 6.83 |
China is the world’s greatest producer of fossil fuels, surpassing the U.S. in both oil and natural gas production, mostly due to its enormous coal production and consumption.
China has consumed more coal in the past ten years than the rest of the world combined.
However, it’s important to note that the nation’s production and use of fossil fuels have decreased recently, ever since the government unveiled a five-year plan back in 2014 to aid in the reduction of carbon emissions.
2. Global energy production from Nuclear Power by Country:
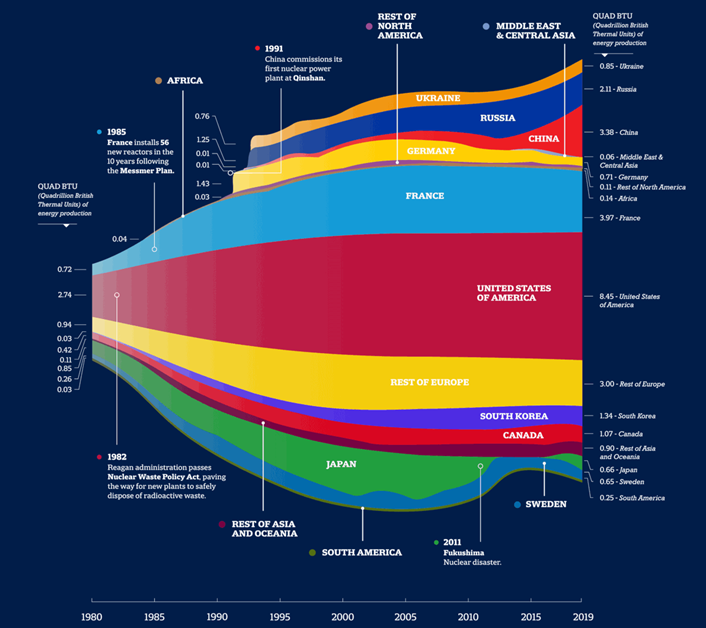
⚛️ Energy production by Nuclear power in QUAD BTU by Country
| Country | QUAD BTU (Quadrillion British Thermal Units) of energy production |
| United States of America | 8.45 |
| France | 3.97 |
| China | 3.38 |
| Rest of Europe | 3 |
| Russia | 2.11 |
| South Korea | 1.34 |
| Canada | 1.07 |
| Rest of Asia and Oceania | 0.9 |
| Ukraine | 0.85 |
| Germany | 0.71 |
| Japan | 0.66 |
| Sweden | 0.65 |
| South America | 0.25 |
| Africa | 0.14 |
| Rest of North America | 0.11 |
| Middle East & Central Asia | 0.06 |
The United States is by far the largest nuclear energy producer in the world, producing roughly twice as much nuclear energy as France, the second-largest producer.
Although nuclear energy offers a carbon-free alternative to fossil fuels, the Fukushima nuclear disaster led many nations to abandon the energy source, which is why usage has decreased globally in recent years.
Approximately 10% of the world’s electricity is still produced by nuclear energy, despite recent shifts in policy in many nations. Additionally, given that decarbonization has become a top concern for countries all over the world, it’s feasible that nuclear energy will play a larger part in the energy mix in the future.
3. Global energy production from Renewable energy by Country:
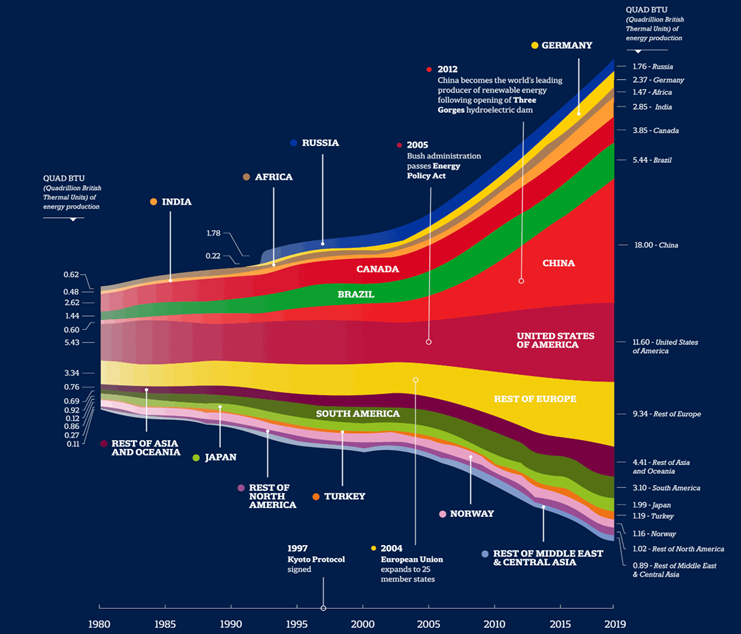
☀️ Energy production by Renewable in QUAD BTU by Country
| Country | QUAD BTU (Quadrillion British Thermal Units) of energy production |
| China | 18 |
| United States of America | 11.6 |
| Rest of Europe | 9.34 |
| Brazil | 5.44 |
| Rest of Asia and Oceania | 4.41 |
| Canada | 3.85 |
| South America | 3.1 |
| India | 2.85 |
| Germany | 2.37 |
| Japan | 1.99 |
| Russia | 1.76 |
| Africa | 1.47 |
| Turkey | 1.19 |
| Norway | 1.16 |
| Rest of North America | 1.02 |
| Rest of Middle East & Central Asia | 0.89 |
About 23% of the electricity produced worldwide comes from renewable energy sources like wind, hydro, and solar. In terms of output of renewable energy, China is in the lead, followed by the United States.
While the production of renewable energy has increased recently, additional nations will need to increase their renewable energy output in order to meet net-zero targets by 2050.
you might want to bookmark our page chart section , we post daily new charts on energy and stocks.


