
American big-box retailer Target Corporation has its corporate headquarters in Minneapolis, Minnesota. with it’s revenue coming from various product lines like Cloths , food and beverages , home furniture etc. let’s briefly discuss Target revenue breakdown by product line , segment
Target revenue breakdown by product line , segment :
Target revenue breakdown 2016 – 2021 in Million US Dollar
| Year | Apparel and Accessories | Beauty and Household essentials | Food and beverage | Hardliners | Home furnishing | Other products | Other Revenues | Total |
| 2016 | $14,304 | $16,550 | $13,831 | $11,507 | $13,130 | $92 | $857 | $70,271 |
| 2017 | $14,662 | $17,025 | $14,256 | $12,062 | $13,672 | $109 | $928 | $72,714 |
| 2018 | $15,004 | $17,726 | $14,585 | $12,709 | $14,298 | $111 | $923 | $75,356 |
| 2019 | $14,304 | $20,616 | $15,039 | $12,595 | $14,430 | $146 | $982 | $78,112 |
| 2020 | $14,772 | $24,461 | $18,135 | $16,626 | $18,231 | $175 | $1,161 | $93,561 |
| 2021 | $17,931 | $27,268 | $20,306 | $18,614 | $20,255 | $237 | $1,394 | $106,005 |
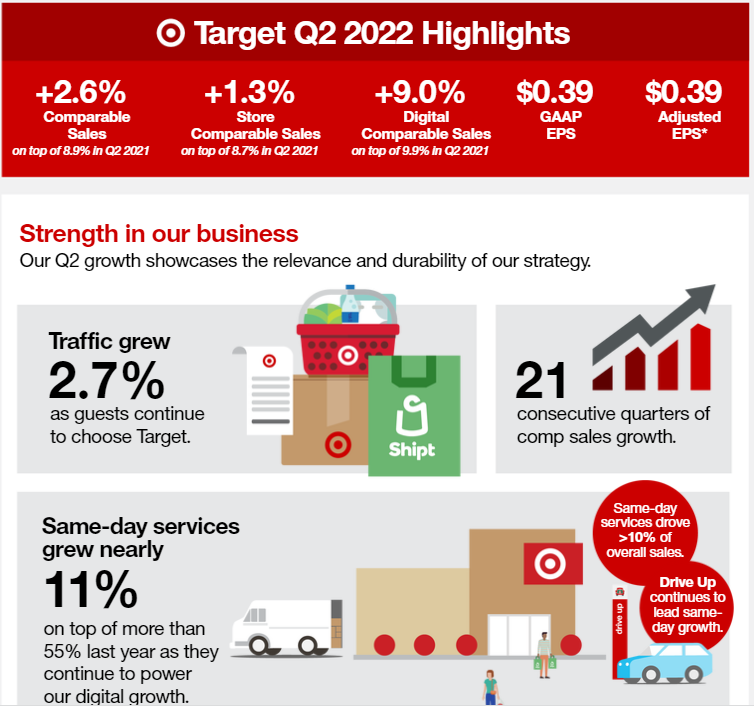
Target Revenue update on latest earning of Q2 : 2022
in 2nd Quarter of 2022 target gained major of its sales in Digital . Beauty and household essentials remains the highest revenue generating product line in this year as well.
Target revenue breakdown 2021 :
Target Corporation‘s sales of domestic and cosmetic products brought in $27,268 million in 2021 as opposed to $24,461 million in 2020. In comparison to 2020, the company’s total net revenues increased by 13.3% in 2021. When compared to 2020, its revenues from the clothes and accessories division increased by $3.16 billion.
You do want to book market our chart section , we upload daily interesting charts.
